What Technical Analysis Actually Is (and Isn't)
Technical analysis is the study of price and volume, not a crystal ball. Learn what charts can honestly tell you, how TA differs from fundamentals, and why it is about probabilities and risk, never certainty.
- ·Price and volume as the only inputs
- ·TA vs fundamental analysis
- ·What charts can and can't predict
- ·Why TA is about probability, not certainty
- ·The three core assumptions
- ·Where TA actually adds an edge
Two people look at the same stock on the same morning. The first has read the company's annual report from cover to cover, the profits, the debts, the people in charge, and is sure the business is worth far more than today's price. The second knows almost none of that, and may not even be certain what the company sells. This second person is watching just two things: the line of prices the stock has printed over the past year, and how busy the trading was at each step. Both can make money. Both can lose. This course is about the craft of the second person.
That craft is called technical analysis, and it carries a reputation problem. To its fans it is a secret language that foretells the future. To its critics it is fortune telling dressed up with a fancy screen. Both are wrong, and the real story is more useful than either. Technical analysis is the patient study of two things, price and volume, which we define in the next breath, used to nudge the odds slightly in your favour rather than to promise a sure thing. It is also, and this matters more, a way to limit the damage when you turn out to be wrong. That second half, limiting the damage, is where most real money is kept, and quietly it is what most of this course is about.
Price and volume: the only two inputs
Strip technical analysis down to the bone and you are left with just two raw ingredients.
Price is simply what the stock last traded at, the figure you see quoted on the screen. Volume is how many shares changed hands to reach that price, in plain words, how busy the trading was. That is the entire foundation.
Every tool in this course is built from those two numbers and nothing else. Trendlines, support levels, candlesticks, moving averages, and indicators that go by short names like RSI and MACD, all of which we unpack slowly later, are simply arithmetic done on price and volume. You do not need to understand any of them yet. Just hold on to one idea: price and volume are the source, and everything else is calculated from them.
Why lean on so little? Because price is the one number that every buyer and seller on earth has already voted on, with real money at stake. Tucked inside it is the optimist who read the annual report and bought, the big fund quietly rebalancing, the trader cutting a loss, and the person who just lost their job and needs the cash today. You will never know each of their reasons, and you do not need to. The chart is just the running scoreboard of that vote.
A price is not one person's opinion about a stock. It is the settled agreement of everyone who has bought or sold it, weighted by how much they traded. Technical analysis is the study of how that agreement forms, holds, and then breaks. You are reading the behaviour of the crowd, not predicting the company's future.
Technical analysis versus fundamental analysis
The clearest way to understand technical analysis is to stand it next to its older sibling, fundamental analysis.
A fundamental analyst asks one question: what is this business actually worth? They dig into earnings, which simply means company profits, along with cash flow, debt, the strength of the brand, and the quality of the managers. From all that they estimate a fair value, and they try to buy when the price sits below it. Their focus is the company.
A technical analyst asks a different question: what is the price doing, and how likely is it to keep doing it? They read the marks that buying and selling leave on the chart, where buyers showed up in force, where sellers took over, whether the move is gaining or losing steam. Their focus is the price action itself, which just means the movement of price over time.
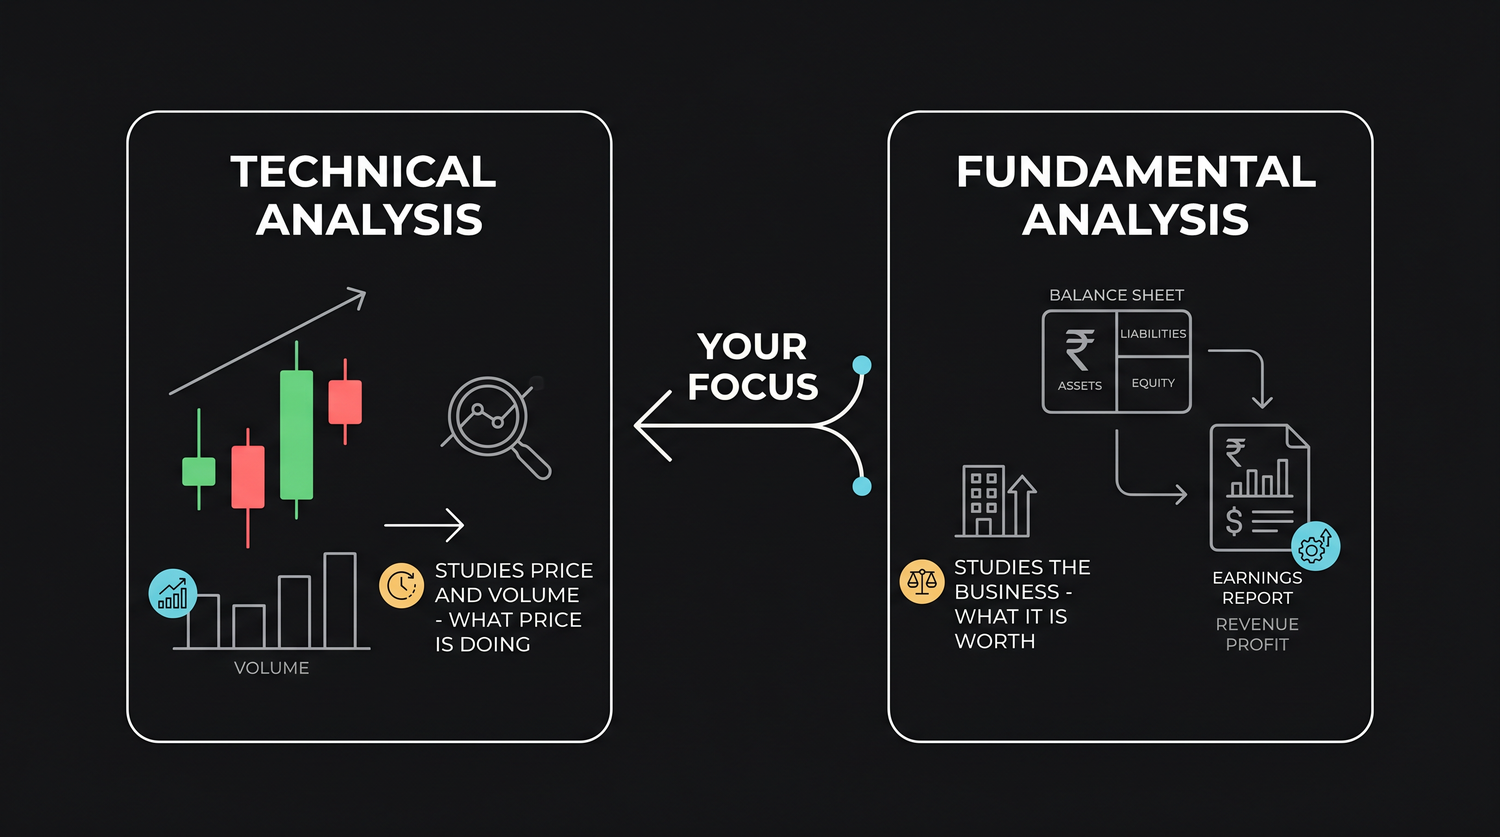
These are different questions on different clocks, not enemies. Fundamentals tend to answer what to own and roughly why, over months and years. Technicals tend to help with when to act and how to manage the position, over days and weeks. Plenty of serious investors use both, fundamentals to choose a shortlist of stocks worth owning, and technicals to time the entry and plan the exit. You do not have to pick a side. You only have to know which question each tool was built to answer.
The three assumptions it rests on
Technical analysis stands on three big assumptions. Knowing them, and knowing where they fail, is what separates a thoughtful chart reader from someone drawing hopeful lines.
- Price discounts everything. "Discounts" here just means "already takes into account". The claim is that all knowable information, earnings, news, rumour, fear, even a quiet trade by an insider, is already baked into the price. A chart reader does not say fundamentals are unimportant. They say the fundamentals have already been voted into the price, so you can read the result instead of chasing the cause.
- Prices move in trends. A trend is simply a persistent direction: up, down, or sideways. Once a direction is set, it tends to keep going rather than flip at random, until something genuinely changes. This one idea is why trend following exists, and why the old saying "the trend is your friend" survived a century of mockery.
- History rhymes. Markets are made of people, and human behaviour repeats: the rush to grab a quick profit, the refusal to accept a loss, the crowd piling in too late. The patterns those habits stamp onto a chart tend to show up again. Not identically. They rhyme.
These are assumptions, not laws of nature. Markets break all three regularly. Trends end, prices shrug off obvious news, and the pattern that "always" worked stops working the month you start trading it. The skill is to treat each assumption as a tendency that pays off over many trades, never a guarantee on the next one.
What a chart can, and cannot, predict
Be honest about the ceiling. A chart cannot tell you tomorrow's price. It cannot promise that a textbook pattern will play out. And it cannot rescue a position that has no plan for being wrong. Anyone selling you those promises is just selling.
What a chart genuinely can do is narrower, but real. It shows you the direction and health of the current trend. It marks the prices where the crowd has reacted strongly before. It flags the moments when the odds of a move shift. And, most valuable of all, it tells you the exact price at which your idea was wrong, so you can step out. The honest description of this whole field is probability, not prophecy. A setup that works six times in ten is excellent. It still fails four times in ten, and you cannot know in advance which of the two you are in.
We did not take the textbook's word for any of this. Every number in this course was measured on 16 years of real daily market data from the NSE, India's main stock exchange. The study covered the Nifty 50, the exchange's index of 50 large companies, using 49 stocks from 2010 to 2026, which works out to 192,786 daily bars. The results are often uncomfortable:
- The famous golden cross buy signal, which we explain in a later chapter, was higher 60 days afterward only 59% of the time, barely better than the market's everyday drift.
- The dreaded death cross sell signal was actually higher 60 days afterward 66% of the time, more often than the golden cross.
- The most "overbought" stocks, meaning those that had risen so fast that a popular gauge called RSI sat above 80, posted the best forward returns of any group we tested, the opposite of what textbooks tell you.
We will show the workings chapter by chapter. For now, absorb the method: measure, do not just believe.
Where technical analysis actually adds an edge
If the popular signals barely beat doing nothing, why bother at all? Because the edge was never really in the signal.
Start with a number that reframes everything. Across our data, the average Nifty 50 stock drifted up about 1.48% over any 20 trading days, simply because the market floats higher over time. That number is the silent benchmark. Almost any signal looks like it "works" until you compare it with just being invested, and then most of the magic evaporates.
The real edge lives in three unglamorous places. First, risk control: a chart gives you objective, decided-in-advance places to exit when you are wrong, which keeps losses small enough to survive. Second, consistency: rules you can repeat beat moods you cannot. Third, framing and timing: when the fundamentals say buy, a chart can stop you from buying into a stock that is dropping fast, what traders call catching a falling knife. Notice that none of these three is prediction.
Build one habit above all others as you read this course: always ask "compared to what?" A signal that is right 60% of the time is only worth using if simply holding the stock was not already right 58% of the time. Check the everyday baseline first, the signal second. This one question will protect you from most of the nonsense in technical analysis.
The thread running through all 28 chapters is this: the indicator is rarely the edge. The discipline around it is. We will hand you the tools honestly, what each one measures, where it helps, and the exact data on where it fails, and then spend the back half of the course on the risk management and psychology that actually keep traders solvent, where solvent simply means still having money left to trade with.
Quick recap
- Technical analysis is the patient study of price and volume to shift the odds in your favour and control risk, not to predict the future.
- A fundamental analyst asks what a business is worth; a technical analyst asks what the price is doing and whether it is likely to continue. They answer different questions and pair well.
- TA rests on three assumptions, price discounts everything, prices move in trends, history rhymes, which are tendencies, not laws.
- Charts deal in probability, not prophecy: they show trend, levels and where you are wrong, but cannot promise an outcome.
- The market's everyday drift, about +1.48% per 20 days, is the benchmark every signal must beat, and many barely do.
- The lasting edge is in risk control, consistency and discipline, not in any single indicator. We tested every claim here on 16 years of real Nifty 50 data.
Next, we open the thing all of this is built on, the price chart itself, and learn to read it without getting lost.