Stacking Indicators Without Fooling Yourself
Five indicators that all say the same thing give false confidence, not five confirmations. Learn to combine one tool from each family, trend, momentum, volatility and volume, and stop the clutter.
- ·The four indicator families
- ·Redundancy vs real confirmation
- ·One tool from each family
- ·Avoiding indicator overload
- ·Indicators confirm, price leads
- ·Building a clean chart template
Open the chart of someone who has just discovered indicators and you will usually find a traffic jam. A moving average laid over the price, then a stack of panels below it, an RSI, a MACD, a stochastic, maybe two more, every one of them glowing green at the same moment. Six tools agreeing feels like six good reasons to buy. It is one of the most comforting sights in trading, and one of the most expensive habits a beginner can pick up.
Here is the catch almost nobody spots early on. The RSI, the MACD and the stochastic are all built from the same raw ingredient: recent momentum, how fast price has been moving lately. When they all flash buy together, they are not six independent experts nodding along. They are one expert, repeating himself in six different accents. To get real confirmation you need tools that look at genuinely different things. Showing you how to do that, with as few indicators as possible, is the whole job of this chapter.
The four families
Almost every indicator ever invented belongs to one of four families, sorted by the single question it answers:
| Family | The question it answers | Example tools |
|---|---|---|
| Trend | Which way is price generally heading? | Moving averages, Supertrend, ADX |
| Momentum | How strong and fast is the current move? | RSI, MACD, stochastic |
| Volatility | How much is price moving right now? | Bollinger Bands, ATR, bandwidth |
| Volume | How many participants are behind the move? | Volume, OBV, money flow |
The idea that changes how you build a chart is this: tools inside the same family mostly repeat each other; tools from different families genuinely add something. RSI and the stochastic are both momentum, so pick one, not both. But a moving average (trend), RSI (momentum), Bollinger Bands (volatility) and OBV (volume) each look at a different dimension of the very same chart. When those four agree, you have something close to real corroboration, four separate witnesses instead of one witness shouting.
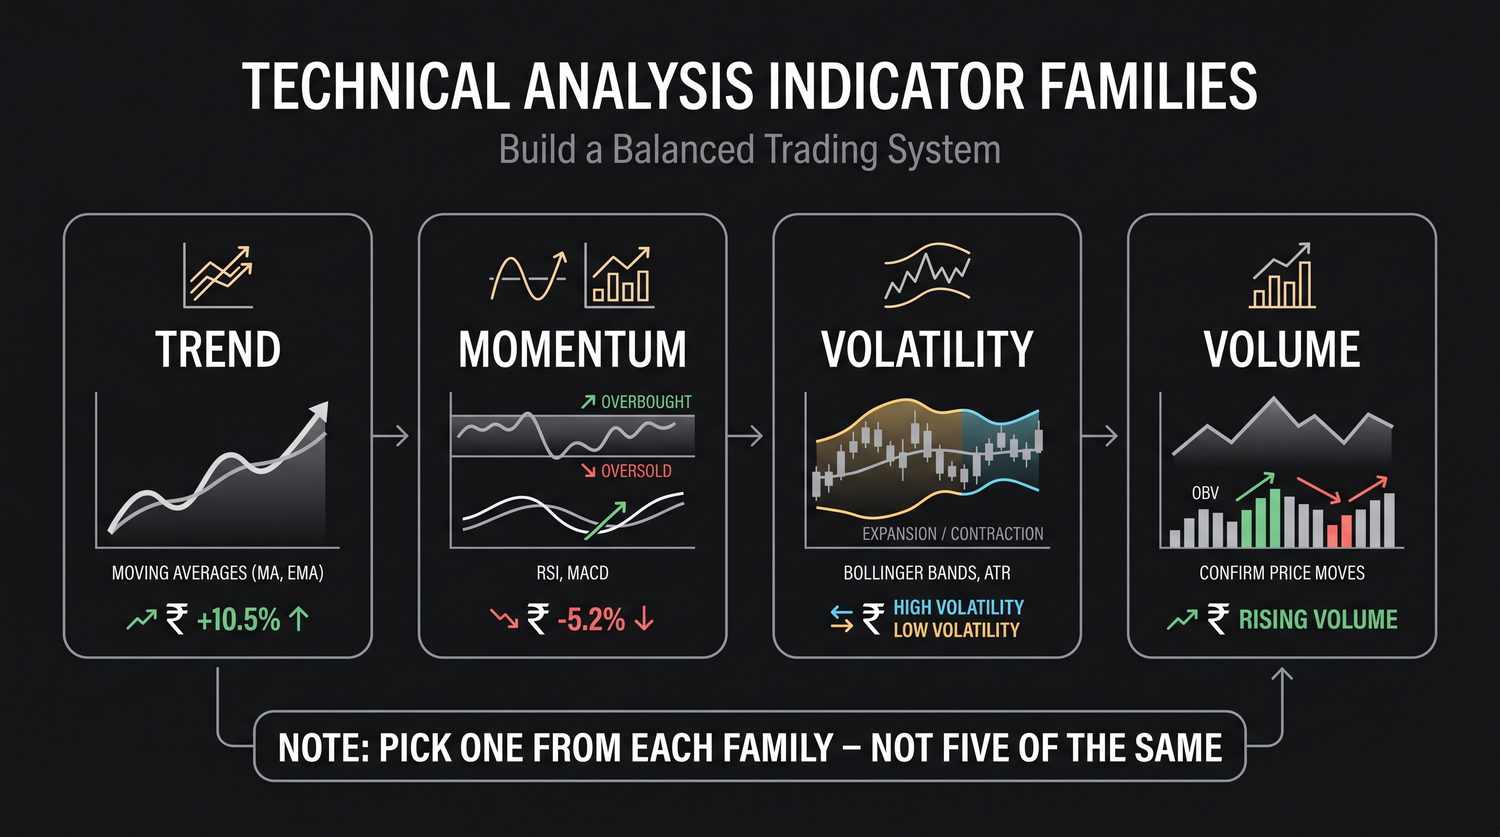
The four families are trend, momentum, volatility and volume. Combine indicators across families, not within one. Five momentum tools all saying buy is one opinion repeated five times, not five confirmations.
Why stacking the same family hurts
It is worth being blunt that piling up same-family tools is not merely useless, it is actively harmful. Three things go wrong:
- False confidence. Five agreeing momentum tools feel like overwhelming proof, so you bet bigger and loosen your stop. But they were always going to agree, because they share an input. You have manufactured certainty out of nothing and staked real money on it.
- A shared blind spot. Because momentum tools ignore volume and volatility, a wall of agreeing oscillators tells you nothing about whether a real crowd is behind the move or whether the stock is so quiet the signal is just noise. The very thing most likely to sink the trade is the thing none of your tools can see.
- Paralysis. More panels means more chances for something to disagree somewhere, on some setting. Traders with twelve indicators rarely pull the trigger, there is always one red light, and when they finally do, they cannot tell you which signal they actually acted on.
If two indicators almost always light up at the same instant, they belong to the same family and one of them is clutter. Adding a second tool that says the same thing as the first does not strengthen the signal. It just hides how much you are really leaning on one idea.
One tool from each family: a worked example
A clean, classic setup uses one tool from a few different families and asks them different questions in order:
- Trend, the filter. Is price above a rising long moving average? This decides whether you should be hunting for buys at all. Trade with the trend, not against it.
- Momentum, the timing. Inside that uptrend, is momentum turning back up after a dip, say RSI lifting off a low? This times the entry within a trend you have already approved.
- Volume, the conviction. Is the move backed by above-average volume? This tells you whether a real crowd showed up, or whether price is drifting on thin air.
Notice how each tool covers a blind spot of the others. The trend filter stops momentum from buying weak counter-trend bounces. Momentum stops you buying a trend that has already run too far without a rest. Volume stops you trusting a move nobody participated in. That is corroboration: three different lenses pointing at one picture. Add a volatility read on top, Bollinger bandwidth or ATR, and all four families are covered, which is also what helps you set a sensible stop and position size.
Before you add any indicator, ask one plain question: which family is it, and do I already own that family? If you already have a momentum tool and you are reaching for another, stop. Spend the slot on a family you are missing, usually volume or volatility, the two that beginners neglect most.
Indicators confirm; price leads
Now the most important sentence in the chapter, the one that quietly undoes most indicator obsession: every indicator is calculated from price, so price always knows first. A moving average is an average of past prices. RSI is a ratio of past price changes. MACD is the gap between two price averages. None of them holds information that is not already sitting in the price and volume bars. They are just re-presentations of that same data, smoothed and scaled to be easier on the eye.
That has a hard consequence. An indicator can never lead price, it can only follow it, because it is built from price that has already happened. When a beginner waits for the MACD to confirm before acting, they are waiting for a delayed echo of a move the candles already showed. Indicators are not a crystal ball bolted on top of the chart. They are a cleaner way of reading the chart you already have.
So the order is fixed: price and structure lead; indicators confirm. You read the trend, the levels and the candles first, that is the signal. Then you let one tool per family raise or lower your confidence in what price is telling you. An indicator should never overrule what price is plainly doing. If price has smashed a major level on heavy volume and your oscillator says overbought, price wins, exactly the lesson from the RSI and Bollinger chapters, where overbought stayed overbought and band touches kept paying.
Every indicator in this course is computed from price and volume. They add no new data, only a clearer view of data you already have. That is why price leads and indicators confirm, never the other way round. A signal that exists only in an indicator, and nowhere in the price itself, is usually noise.
Avoiding indicator overload
The cure for a cluttered chart is subtraction, not addition. A simple discipline keeps you honest:
- One tool per family, four at most. If you cannot justify an indicator by naming its family and the question it answers, it comes off the chart.
- Default to fewer. Most professional charts carry one or two indicators, not eight. Trend plus volume covers an enormous amount of ground on its own.
- Know what each one is blind to. A trend tool is blind to exhaustion, a momentum tool is blind to participation, a volatility tool is blind to direction, a volume tool is blind to where price sits in its range. Your handful should patch the holes, not pile up in one corner.
- Let disagreement mean something. When your trend tool and your momentum tool point opposite ways, that conflict is information, usually "the trend is intact but stretched, wait for the pullback," not a reason to bolt on a tie-breaker indicator.
A clean chart template
Put it together and an honest, professional-feeling chart needs surprisingly little:
- Price as candlesticks, the primary signal, always.
- Key levels, the support and resistance zones and trendlines you drew by hand.
- One trend tool, for example a 50-day moving average, to keep you on the right side of the market.
- One volume read, the volume bars with their 20-day average, or OBV, to gauge conviction.
- Optionally one momentum or one volatility tool, RSI or Bollinger Bands, for the dimension you care about most. Not both of everything.
That is it. Price and levels do the heavy lifting; three or four indicators, one per family, confirm. Anyone whose chart is busier than this should be able to name the family and the job of every single line on it, and most cannot, which is precisely why their charts are so crowded.
A trader watches BEL break above resistance. Price leads: the breakout is right there in plain candles. Trend confirms: price is above a rising 50-day average. Volume confirms: the breakout bar trades well above its 20-day average. Volatility frames it: the bands had squeezed beforehand, so an expansion was due. Four families, one decision, one clean chart, and not a single redundant oscillator in sight.
Quick recap
- Indicators sort into four families, trend, momentum, volatility and volume, each defined by the question it answers.
- Tools within a family largely repeat each other; combine across families for genuine confirmation. Five momentum tools agreeing is one opinion, not five.
- Stacking the same family breeds false confidence, a shared blind spot and paralysis. The cure for overload is subtraction.
- A clean setup uses one tool per family: trend filters, momentum times, volume confirms conviction, volatility sizes the risk.
- Price leads; indicators confirm. Every indicator is computed from price, so it can only follow, a cleaner view of the chart, never a crystal ball on top of it.
- A professional chart is mostly price and levels, plus three or four non-redundant indicators, and you should be able to name the job of every line.
You can now read a single chart from four angles at once, using only a handful of tools. But you may be wondering what all the other indicators are for, the hundred-odd names you keep seeing. Next, we take a friendly walk through the full toolbox, so you know what exists, what each family is good at, and why you still only ever need a few.