The Full Indicator Toolbox: 80+ at Your Fingertips
OpenAlgo's library carries 80+ indicators across trend, momentum, volatility, volume, oscillators, statistics and hybrids. This is your map of the whole toolbox: what each family is for, the standouts in each, and how to choose a few without drowning.
- ·The seven indicator families
- ·Trend and moving-average variants
- ·Momentum and oscillators
- ·Volatility and channels
- ·Volume and money-flow
- ·How to choose, and what to ignore
By now you have met a dozen or so indicators by name, and you might be feeling a quiet panic. When you open a serious charting tool, the indicator menu does not stop at a dozen. It scrolls, and scrolls, past names you have never heard of, well over a hundred of them. The library that powers this course alone carries more than a hundred ready-made indicators. It is enough to make a beginner feel hopelessly behind before they have even started.
Take a breath, because the truth is the opposite of intimidating. That giant list is not a hundred different ideas you must learn. It is a handful of ideas, each rebuilt a dozen different ways by a dozen different people over the decades. Once you can see the families underneath the names, the whole menu collapses into something small and friendly. This chapter is your map. We will walk the seven families, see what each one is actually for, point out the standouts, and then, most importantly, show you how to ignore almost all of them on purpose.
From four families to seven
In the last chapter you learned the four families you build a chart with: trend, momentum, volatility and volume. Those four are the practical core, the ones you reach for every day. A full library, though, sorts its hundred-plus tools into a slightly finer set of seven groups, because some tools do not fit neatly into the everyday four.
The three extra groups are nothing to fear. Oscillators are really just close cousins of momentum, gauges that swing between a low and a high extreme. Statistical tools borrow from mathematics to measure things like how tightly two stocks move together. Hybrid tools blend two families into one, like a trend tool that also reads volatility. Think of the four everyday families as the tools on your desk, and the other three as the specialist drawer you open only now and then.
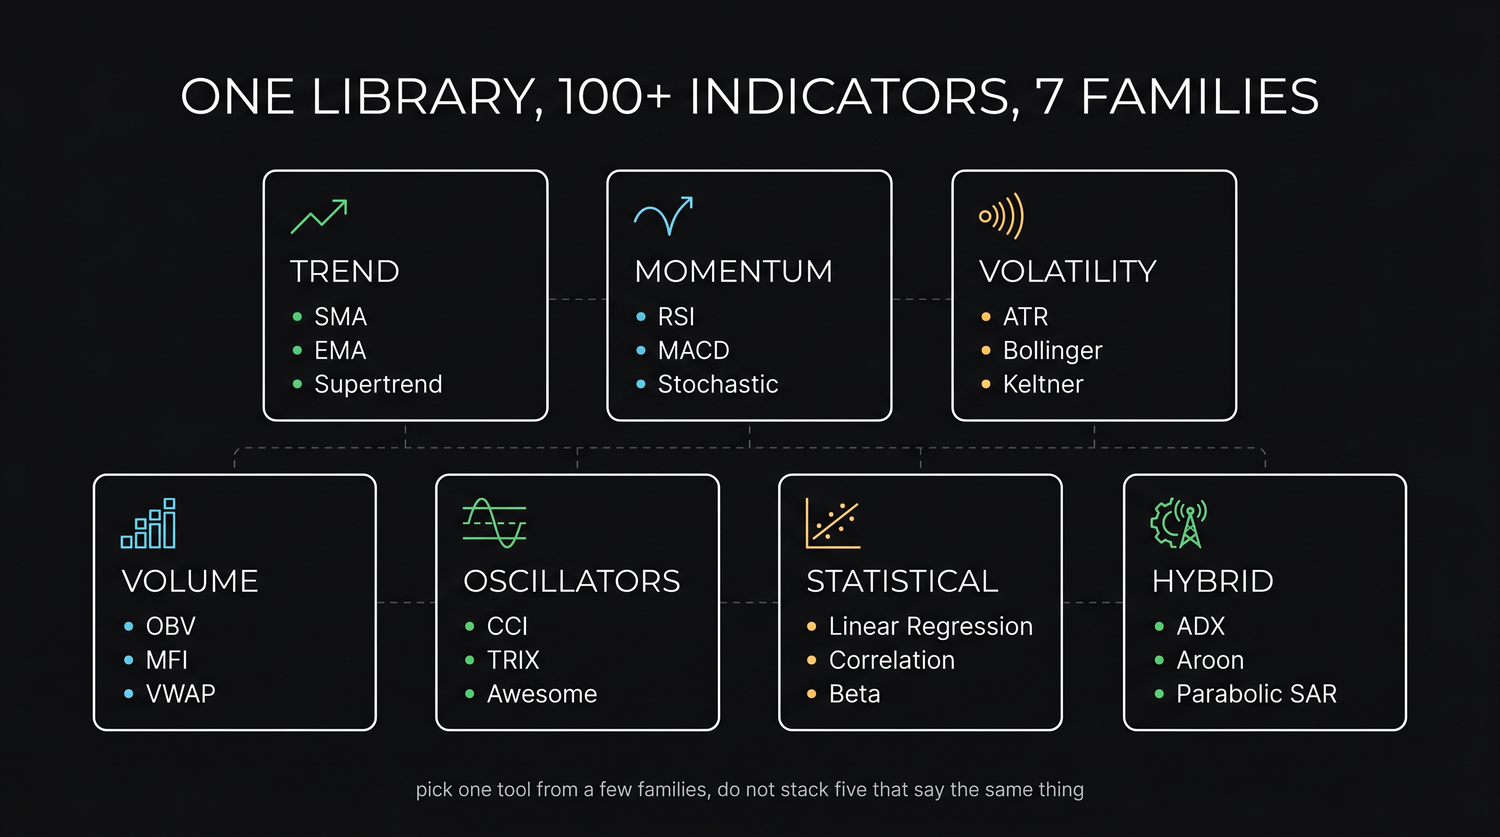
The seven families at a glance
Here is the entire toolbox on one page. Read it as a map, not a syllabus; you are not meant to memorise the right-hand column.
| Family | The question it answers | A few examples |
|---|---|---|
| Trend | Which way is price heading? | Moving averages, Supertrend, ADX, Ichimoku, Parabolic SAR |
| Momentum | How strong and fast is the move? | RSI, MACD, rate of change, momentum |
| Volatility | How much is price moving? | Bollinger Bands, ATR, Keltner channel, Donchian channel |
| Volume | Who is behind the move? | Volume, OBV, Money Flow Index, Chaikin Money Flow, VWAP |
| Oscillators | Is price stretched to an extreme? | Stochastic, CCI, Williams %R, Stochastic RSI |
| Statistical | What do the numbers say about price? | Linear regression, correlation, beta, standard deviation |
| Hybrid | A blend of two jobs at once | Supertrend, Ichimoku, ADX, SAR |
Notice that a few names appear in more than one row. Supertrend is both a trend tool and a hybrid, because it blends trend with volatility. That overlap is normal and nothing to worry about; it just means a clever tool can do more than one job.
What each family is for
A short tour, with the standout you would actually pick from each.
Trend tools answer which way price is leaning. This is the family you met across the moving-average and trend chapters: simple and exponential averages, the volatility-trailing Supertrend, the ADX strength gauge, the Ichimoku cloud, the Parabolic SAR. For a beginner, a single moving average does almost everything you need here.
Momentum tools measure how forceful the current move is, how fast price is travelling rather than where it is. RSI and MACD are the headliners. One of them is plenty.
Volatility tools measure how much price is jumping around, with no view on direction. Bollinger Bands show whether the market is calm or wild, and the ATR, the Average True Range, gives you the typical daily move in rupees, the ruler you size stops with. The standout for risk control is the ATR.
Volume tools ask who is actually behind a move. Raw volume bars are the start; OBV adds volume up on up-days and subtracts it on down-days to show whether buyers or sellers are accumulating; the Money Flow Index is a volume-weighted RSI; VWAP marks the average price weighted by volume. OBV or plain volume is enough to begin.
Oscillators are bounded gauges that swing between a floor and a ceiling, usually 0 to 100, flagging when price looks stretched. The Stochastic, CCI and Williams %R all live here. They are first cousins of RSI and they carry the very same warning you learned earlier: an extreme reading can stay extreme for a long time in a strong trend. Overbought is not a sell.
Statistical tools bring mathematics to the chart. Linear regression draws the straightest line through price; correlation and beta measure how closely a stock moves with the broader market; standard deviation measures how spread out the moves are. These are more advanced, more useful for comparing stocks and building systems than for reading a single chart, and a beginner can happily leave them in the drawer for now.
Hybrid tools deliberately fuse two families. Supertrend marries trend and volatility; Ichimoku layers trend, momentum and support all into one cloud; the ADX combines directional readings into a single strength number. They are powerful precisely because they look at more than one thing at once, which is also why they need a little more care to read.
The library has seven families: trend, momentum, volatility, volume, oscillators, statistical and hybrid. The first four are your everyday desk; oscillators are momentum's cousins; statistical and hybrid are the specialist drawer. Knowing the family of any new indicator tells you most of what it does before you read a word about it.
How a beginner picks just a few
The rule from the combining chapter does all the work here, so let it: one tool from each everyday family, and skip the rest. A complete, honest read of a chart needs only four numbers:
- one trend tool, say a 50-day moving average, for direction;
- one momentum tool, say RSI, for the strength of the move;
- one volatility tool, say ATR, to size your stop;
- one volume tool, say OBV or plain volume, to check who is behind it.
That is four indicators covering four different dimensions, and it will out-read a chart smothered in twelve. When you meet a tempting new name in the menu, do not ask "is this better than what I have?" Ask "which family is it in, and do I already own that family?" Almost always you already do, and the new tool is a different accent on a voice you can already hear.
The simplest first-timer takeaway: you do not start by learning indicators, you start by learning the four questions, which way, how strong, how much, and who. Pick one tool that answers each, learn those four deeply, and treat the other ninety-something as optional reading for years from now.
Why the other hundred exist at all
If four tools are enough, why does the library hold a hundred? For honest reasons, none of which is your problem yet. Many are small variations invented to shave a little lag or smooth a little noise off an older tool. Some are built for specific jobs, options, intraday scalping, comparing baskets of stocks, that you may never do. Some are simply historical, kept because somebody, somewhere, still relies on them. A few are genuinely brilliant in expert hands.
The mistake is to read that long menu as a to-do list. It is a reference shelf. A library having ten thousand books does not mean you must read them all to be literate; it means the right book is there when you finally need it. The same is true here. The depth of the toolbox is a comfort, not a burden, because the day you have a precise question, the precise tool already exists.
Collecting indicators is a way of feeling productive without getting better. Every new tool you add to a chart is another thing to interpret, another chance for a false signal, another excuse to hesitate. The traders who pile on the most indicators are rarely the ones making the most decisions. More tools is not more skill.
Every one of the hundred-plus indicators, in all seven families, is still computed from price and volume. Not one of them adds new information about the future. They only repackage the same past data into different shapes. That is why a small, well-chosen handful beats a crowded screen: extra tools add clutter, never new facts.
Quick recap
- A full indicator library holds more than a hundred tools, but they collapse into seven families: trend, momentum, volatility, volume, oscillators, statistical and hybrid.
- The four everyday families, trend, momentum, volatility and volume, are your desk; oscillators are momentum's cousins, and statistical and hybrid are the specialist drawer.
- Knowing a tool's family tells you most of what it does and which question it answers before you read anything else.
- A beginner needs one tool from each everyday family, four numbers covering which way, how strong, how much and who, and can ignore the rest.
- The other hundred are a reference shelf, not a to-do list. They are variations, specialists and historical tools, and they all still draw on the same past price and volume.
- You do not need all hundred. You never will. A small, deliberate handful, used well, beats a screen smothered in indicators every time.
You now have the whole landscape in view and a short, sane list of tools to actually use. So far, though, every tool we have discussed has looked at a single chart. Next, we change the zoom: we read the same stock across two timeframes at once, using the bigger picture to set direction and the smaller one to time the entry.