Two- and Three-Candle Tells
Engulfing, harami, morning and evening stars, patterns where a few candles together flip the story. See how each forms and where they actually marked turns on real charts.
- ·Bullish and bearish engulfing
- ·The harami
- ·Morning star and evening star
- ·Three white soldiers / black crows
- ·Tweezer tops and bottoms
- ·Reliability of multi-candle patterns
One candle whispers. Two or three candles, read together, can argue a case. When you let a few bars speak as a group, a fuzzy hint sharpens into something closer to a statement: yesterday the sellers were in charge, today the buyers completely overpowered them, and the handover of control is visible in the shapes themselves. That hand-off, caught across two or three days, is what multi-candle patterns try to capture.
They are more trustworthy than a single candle for a simple reason: they demand more agreement before they count. A so-called engulfing pattern is not one good day; it is a bad day followed by a day so strong it wipes out the one before. But "more trustworthy" is a relative phrase, and this is exactly where most candlestick books oversell. Even the best of these patterns is a small tilt in the odds, not a prophecy, and the proof is that the same shape that nails a famous turn on one chart fizzles out on the next ten. We will meet the patterns, then look hard at one real example and at what the word "reliable" honestly means.
Engulfing: one candle swallows the last
The engulfing pattern is the workhorse of the group. It is two candles where the body of the second one completely covers, or engulfs, the body of the first.
- A bullish engulfing appears in a downtrend, a stretch of falling prices. First a small red, or down, candle, then a larger green, or up, candle whose body opens below the previous close and closes above the previous open. The buyers did not just win the day, they erased the whole of the previous day's selling.
- A bearish engulfing is the mirror image in an uptrend, a stretch of rising prices: a small green candle swallowed by a larger red one. Sellers overwhelmed the day before.
The logic is easy to feel. For the second candle to engulf the first, one side had to show up with real size and reverse the entire prior session. That visible change of control is why engulfing patterns carry more weight than, say, a lone doji, a candle that just shows indecision.
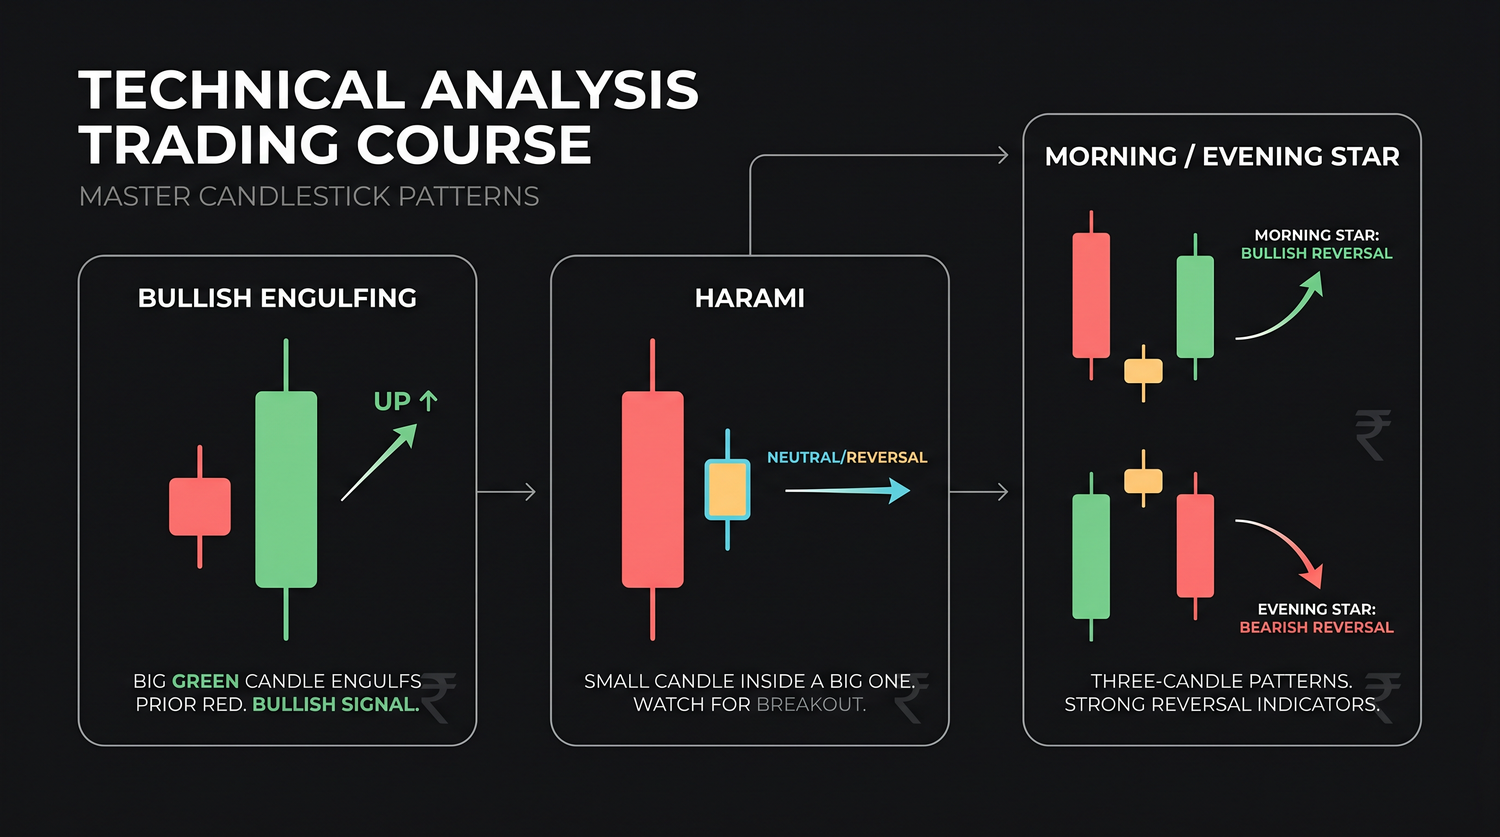
The harami: a sudden loss of momentum
The harami, which means "pregnant" in Japanese, is the engulfing pattern flipped in size: a large candle followed by a small one whose body sits entirely inside the body of the one before. After a long green candle in an uptrend, a small candle tucked inside it says the buying surge has abruptly stalled. After a long red candle in a downtrend, a small inside candle hints the selling has paused.
A harami is a weaker signal than an engulfing. It shows hesitation, not a takeover. Nobody seized control; the side that was winning simply ran out of breath. It is a flag to watch for further proof, rarely a reason to act on its own.
Morning star and evening star: a three-candle turn
The stars are three-candle patterns, and they tell a fuller story of a turn.
- A morning star is bullish and forms at a bottom: a long red candle (the downtrend in force), then a small-bodied candle that gaps or stalls lower (selling momentum fading, the "star"), then a long green candle that pushes well back into the body of the first candle (buyers seizing control). Think of dawn arriving after a long night.
- An evening star is the bearish mirror at a top: a long green candle, a small undecided candle, then a long red candle driving down into the first body.
The middle candle is the pivot, the moment of balance between the old trend and the possible new one. The third candle is the confirmation that control actually changed hands. Because they require that full three-act structure, stars are among the more respected candle reversals.
Notice the pattern inside the patterns: the more candles a signal demands, the more agreement it captures, and the more weight it carries. A single doji is indecision; an engulfing is a takeover; a morning star is a takeover with a confirming follow-through. None of them is a guarantee, but a three-candle star asks the market to prove more before it qualifies.
Three white soldiers and three black crows
These are momentum signatures, not reversal signatures. Three white soldiers are three green candles in a row, each opening inside the previous body and closing near its high, a steady, convincing advance, often seen as a downtrend ends and buyers take lasting control. Three black crows are the bearish mirror: three long red candles marching down, a sign of heavy, persistent selling.
The honest caution: by the time you have actually seen three big candles in one direction, a good chunk of the move is already behind you. These patterns confirm that a trend has strength, but they are a poor place to jump in late and chase.
Tweezer tops and bottoms
A tweezer is two or more candles that share almost the same high, a tweezer top, which leans bearish, or almost the same low, a tweezer bottom, which leans bullish. The matching extremes show that price tested a level twice and got rejected both times, a small double-test of support or resistance squeezed into neighbouring candles. On their own they are weak. At a level that already matters, they add a little confirmation.
A real bullish engulfing, and why one example proves nothing
Now the part that keeps us honest. Here is a genuine, textbook-clean bullish engulfing on State Bank of India. On 30 December 2025, at a swing low around 973.5, after a pullback, the stock printed a green candle that engulfed the previous day's red one. Over the next 10 trading days it rose about 5.7%. The pattern worked.
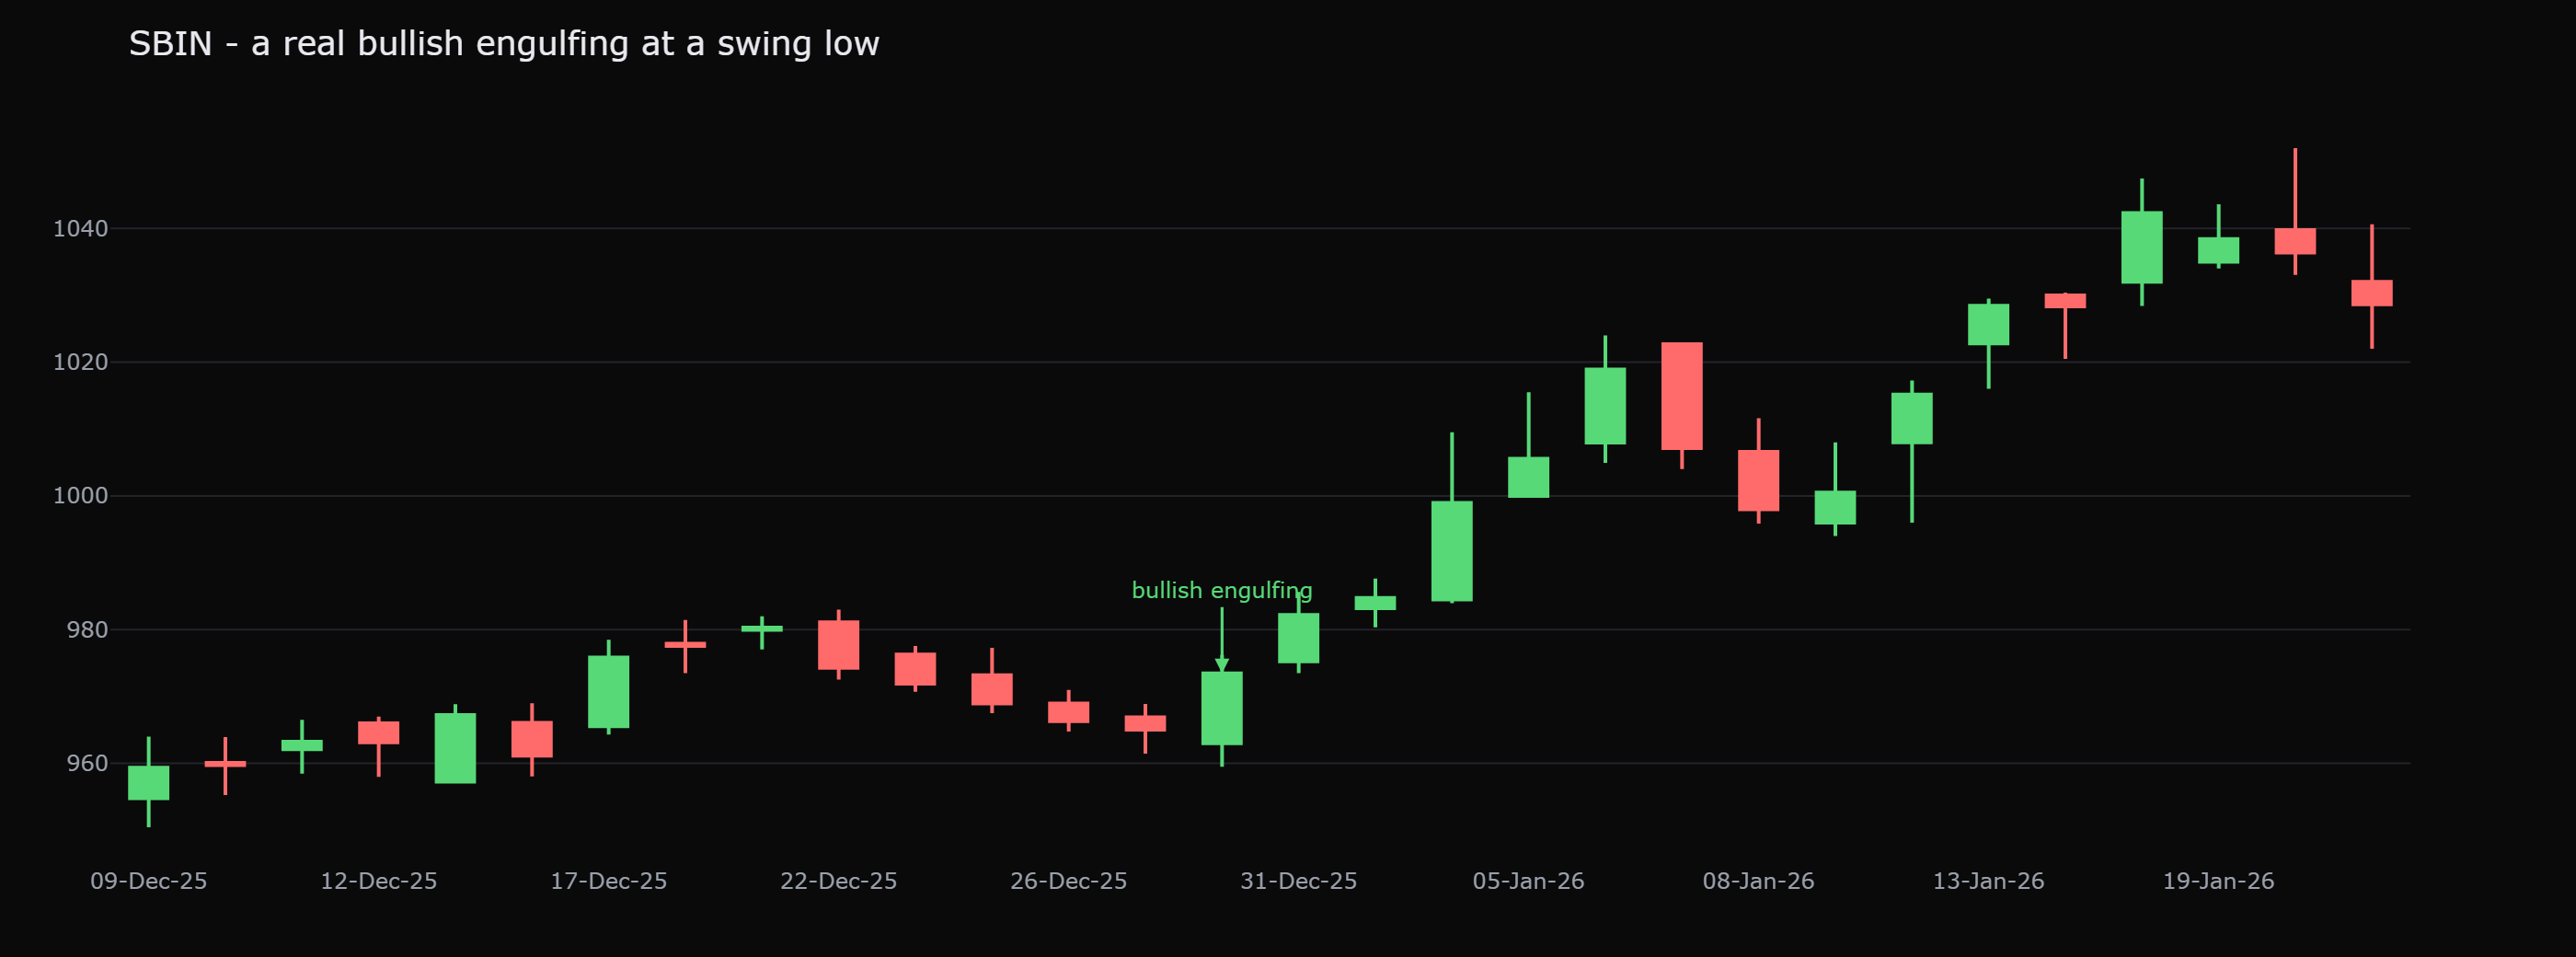
It is a lovely illustration, and that is all it is. One winning example tells you the pattern can work; it tells you nothing about how often it works. This is the trap candlestick lore is built on: the books show you the chart where the morning star nailed the bottom, and quietly skip the dozens where the identical shape appeared and price just kept falling. A single hand-picked chart is selection bias dressed up as evidence. Selection bias means showing only the examples that flatter your point.
Never let a single perfect example set your expectations. For any pattern you could find a chart where it worked beautifully. That is true even of patterns with no real edge at all, simply because markets generate thousands of candles. The question that matters is never "did it work here?" but "across hundreds of times this appeared, how often did it work, and by how much, compared with just being invested?"
What "reliable" honestly means
So how reliable are multi-candle patterns? Modestly. They genuinely improve on single candles, because they demand more confirmation, and a real change of control is real information. But the edge is small and fragile, and it lives almost entirely in context, where the pattern forms, which is the whole point of the next chapter.
Borrow a number from measured data. A 20-day breakout, the moment price pushes above its highest level of the past 20 days, is another "the move has turned" signal. It fails about 56% of the time, slipping back below the breakout level within five days. Add a volume filter, only counting breakouts on more than 1.5 times the average volume, and the failure rate drops to about 47%, with better returns on the ones that work. Two lessons carry straight across to candle patterns. First, even a respected technical signal can fail more often than it works on its own. Second, confirmation, here in the form of volume, is what shifts the odds from a coin toss toward a slight edge.
The simplest way to use these patterns: treat them as a reason to look closer, never as a complete reason to trade. A pattern says "control may have changed here." Before you act, ask for it to appear at a level that matters, in the direction the larger trend allows, ideally with a pickup in volume. The pattern is the spark; context is the fuel, and without fuel the spark just dies.
The reason a bullish engulfing on heavy volume, at tested support, after a clean downtrend is worth more than the same candle floating in mid-air is not mysticism. It is that several independent conditions now agree, and agreement is what nudges a coin-toss signal toward a genuine edge. The candle pattern contributes one vote, an important one, but only one.
Quick recap
- Engulfing patterns (a candle that swallows the prior body) show a visible change of control and carry more weight than any single candle.
- The harami is the reverse, a small inside candle showing momentum stalling, a weaker, watch-and-wait signal.
- Morning and evening stars are three-candle reversals; the small middle candle is the pivot, the third candle is the confirmation.
- Three white soldiers and three black crows confirm momentum but appear late; tweezers mark a twice-tested level.
- One clean example (the 5.7% bullish engulfing on State Bank of India) is an illustration, not a base rate, and even respected signals like a breakout fail more often than they work alone.
- Reliability is modest and lives in context; treat every pattern as a trigger to look, confirmed by level, trend and volume.
That last point deserves a chapter of its own. Next we will see exactly why a hammer in the middle of nowhere is noise, and the same hammer at strong support is a signal.