Pauses, Not Reversals: Continuation Patterns
Flags, pennants, triangles and rectangles are the market catching its breath before continuing. Learn to tell a healthy pause from a genuine reversal, with real chart examples.
- ·Flags and pennants
- ·Ascending, descending, symmetrical triangles
- ·Rectangles and consolidations
- ·Measuring the move after a break
- ·Continuation vs reversal
- ·Where these patterns fail
A strong trend does not move in a straight line. It surges, then pauses; surges, then pauses again. Those pauses are where most newcomers get shaken out. The trend looks like it is rolling over, people who are sitting on profits cash them in, the chart goes quiet, and then, right at that moment, it picks up exactly where it left off. Continuation patterns are the shapes those pauses make, and learning to read them is mostly about learning not to mistake a breather for the end.
The previous chapter was about trends ending. This one is about trends resting. The same sideways squeeze that a nervous trader reads as "the top is in" is often just the market catching its breath. The skill is telling the two apart, and the honest news is that you usually cannot, not with certainty, until price breaks out of the pause and settles the question for you. So we will treat these patterns the same way we treated reversals: as setups that must confirm, with a measured target to judge the reward and a defined level that tells you when you were wrong.
What a continuation pattern is
A continuation pattern is a consolidation that interrupts a trend without reversing it. Consolidation just means a quiet, sideways stretch where price stops trending and trades in a tight zone. Price has run, it needs to digest the move, so buyers and sellers fight to a temporary draw inside a tidy range, triangle or channel. When the pattern resolves, it usually resolves in the direction of the trend that came before it. The pause ends and the move continues. The key word is usually: the same shapes can, and sometimes do, break the other way and become reversals. The pattern does not decide; the breakout does.
The defining feature of a continuation pattern is the trend before it. A flag after a sharp rally is a continuation candidate. The identical flag drawn on a directionless chart is just a range. Always read the pattern in the context of the move that led into it.
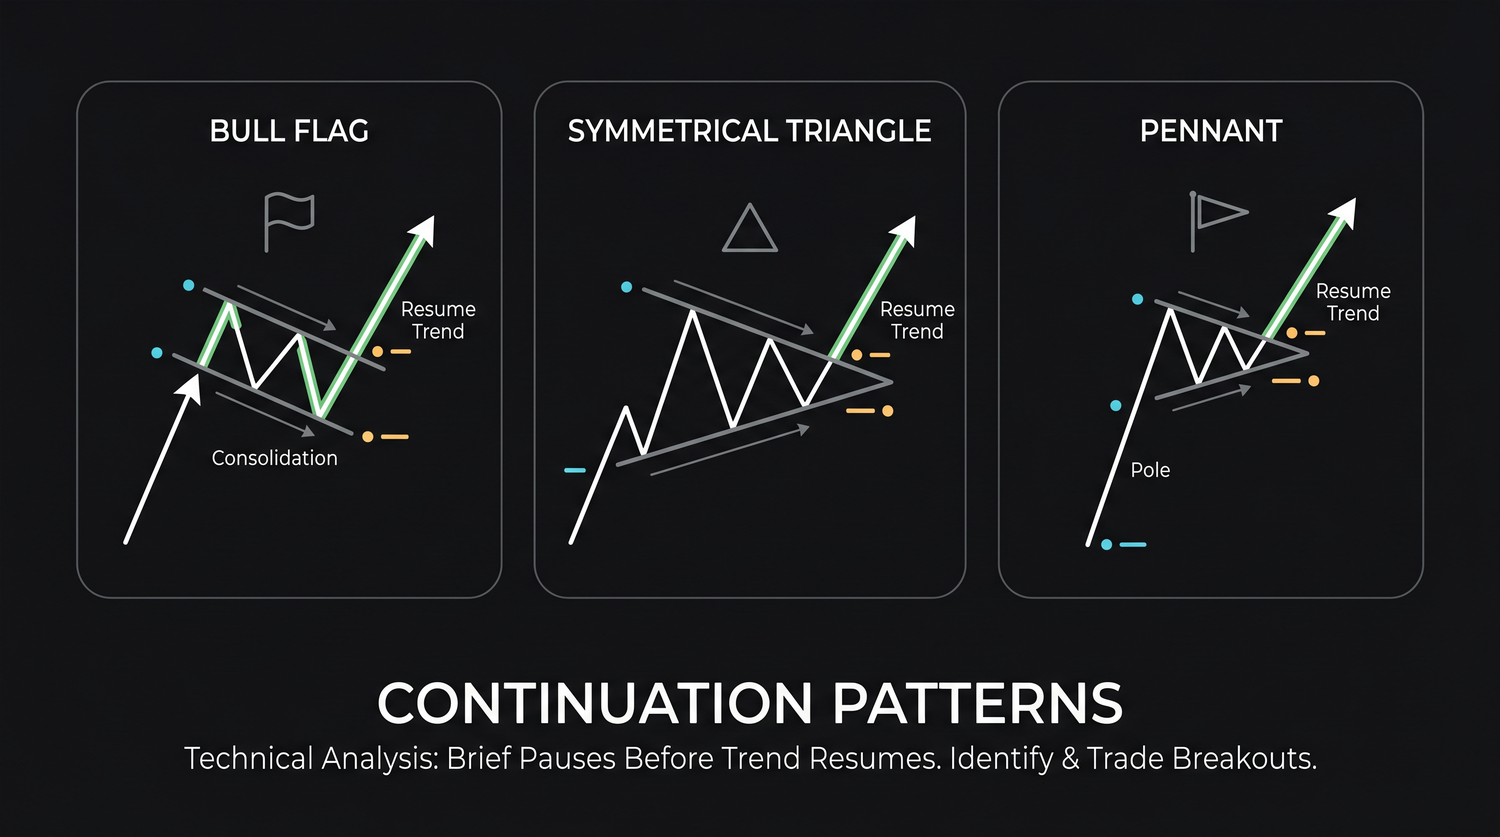
Flags and pennants
Flags and pennants are the short, sharp pauses that follow an almost vertical move, the "flagpole". A flag is a small rectangle that drifts gently against the trend: a bull flag slopes slightly down, a bear flag slightly up. A pennant is a small triangle that contracts to a point. Both are brief, typically a handful of days to a few weeks, and both are a quick rest after a strong thrust before the trend resumes.
The reason they tilt against the trend matters. After a hard rally, weak hands, the less committed buyers, take profits, and the pullback stays shallow and orderly because dip-buyers keep stepping in. That shallow, controlled drift is the signature of a pause rather than a top. A flag that turns into a deep, accelerating sell-off is no longer a flag, it is telling you the move is over.
Triangles: ascending, descending, symmetrical
Triangles are longer consolidations where the range narrows as buyers and sellers slowly converge. There are three of them.
| Triangle | Shape | Typical lean |
|---|---|---|
| Ascending | Flat top, rising lows | Buyers getting more aggressive; often breaks up |
| Descending | Flat bottom, falling highs | Sellers getting more aggressive; often breaks down |
| Symmetrical | Lower highs and higher lows | Neutral coil; breaks in the trend's direction more often than not |
An ascending triangle has a flat resistance line getting hit again and again while the lows keep rising, buyers willing to pay up sooner each time, pressing price against a ceiling until it gives way. A descending triangle is the mirror, with sellers pressing on a floor. A symmetrical triangle coils between two converging lines and carries the least directional bias on its own, which is exactly why the trend that led into it is your best guide to which way it is likely to break.
Do not assume the lean. An ascending triangle "should" break up and a descending one "should" break down, but plenty break the other way, and a descending triangle inside a strong uptrend often resolves upward. The shape suggests a bias; only the actual break confirms it. Trade the break, not the prediction.
Rectangles and consolidations
A rectangle is a flat range, with price bouncing between a horizontal floor and ceiling, that appears within a trend rather than at its end. It is the market in a holding pattern, with neither side able to push through. In a continuation setting, a rectangle in an uptrend tends to break upward as the trend reasserts itself. But a rectangle is also the most ambiguous of these shapes: the very same flat range is what a reversal, such as a double top, looks like while it is forming. Once again, the resolution, meaning which boundary breaks, is what names the pattern.
Measuring the move after a break
Like reversals, continuation patterns come with a geometric target. For flags and pennants, the classic method measures the flagpole, the height of the sharp move that came just before the pattern, and projects that same distance from the breakout point. The idea is that the move "continues" by roughly as much as it had already run. For triangles and rectangles, you measure the height of the pattern at its widest point and project it from the break. A genuine pause also tends to show falling volatility, how much price jumps around, with the daily range narrowing as the pattern matures, something you can usually see by eye.
The simplest way to use a measured move: treat it as a reward estimate, nothing more. Pair it with the level that would prove you wrong, usually the far side of the pattern, to get a reward-to-risk ratio before you enter. If the projected target is barely larger than the distance to your stop, the cleanest-looking pattern in the world is not worth taking.
There is a deeper reason these targets are only estimates. A continuation pattern is the market reaching a temporary balance, and balance can resolve in either direction, or simply fizzle into a longer range. The flagpole projection assumes the second half of the move mirrors the first; sometimes it overshoots, often it falls short, and occasionally the breakout fails outright and the "second half" never arrives. Treat the number as a way to decide whether the trade is worth taking, not as a price the market owes you. The discipline is in the entry, the stop and the position size; the target just helps you judge whether the maths is favourable before you commit.
Continuation versus reversal
This is the question the whole chapter circles around, and it deserves an honest answer: you often cannot know in advance. A symmetrical triangle, a rectangle, even a flag can resolve either way. What tilts the odds toward continuation is straightforward and worth a short checklist.
- A strong, clear trend leading into the pattern.
- A pause that is proportionate, a shallow flag or a tidy coil, not a deep, violent change of character.
- Volume that dries up through the consolidation and expands on the breakout in the trend's direction.
- A break that resolves on the same side as the prior trend.
When those align, you have a continuation setup. When the "pause" is deep, volume swells against the trend, and price breaks the opposite way, you are most likely watching a reversal, and the right response is to respect it, not to argue with the chart.
Where these patterns fail
A breakout from a flag or triangle is still just a breakout, the moment price pushes past the boundary, and breakouts fail at uncomfortable rates. Measured across the Nifty 50, 56% of 20-day breakouts fell back below the breakout level within five days, more often a false move than a clean run. Filtering for volume helped but did not rescue it: breakouts on more than 1.5 times the average volume failed 47% of the time, with better follow-through on the ones that worked. So volume confirmation tilts the odds and improves the survivors, but roughly half still fail either way.
"Patterns are reliable" is the comforting half-truth this course keeps puncturing. Even a textbook continuation pattern that breaks the right way has, historically, been close to a coin flip on follow-through. The edge does not live in spotting the shape, it lives in waiting for the break, demanding volume, sizing for a stop, and accepting that a large share will fail. Risk control, not pattern recognition, is what keeps you in the game.
Trading them without fooling yourself
The practical routine mirrors the reversal chapter. Identify the trend first. Mark the pattern's boundaries before the break, not after. Wait for a decisive close beyond the boundary, ideally on expanding volume. Use the measured move as your reward and the far side of the pattern as your stop, and only take the trade if the two make sense together. Expect the retest, where price frequently throws back to the broken boundary before continuing, and that retest is often a lower-risk entry than chasing the first candle. And keep your humility intact: about half of even good-looking breaks do not follow through, so no single pattern deserves an outsized bet.
Quick recap
- Continuation patterns are pauses in a trend, not turns: flags, pennants, ascending, descending and symmetrical triangles, and rectangles.
- The trend before the pattern is what makes it a continuation candidate; the breakout direction is what confirms it.
- Measure the flagpole (flags and pennants) or the pattern height (triangles and rectangles) and project it from the break to set a target, a reward estimate, not a promise.
- Volume should dry up through the pause and expand on the break; a break against the trend on swelling volume points to reversal instead.
- Breakouts fail often (56% of 20-day breakouts snapped back within five days; 47% even on high volume), so confirm, expect a retest, and size for the stop.
Next: sometimes price does not consolidate at all, it leaps. We turn to gaps, the jumps that open well away from yesterday's close, and what each kind really tells you.