Single Candles That Whisper a Turn
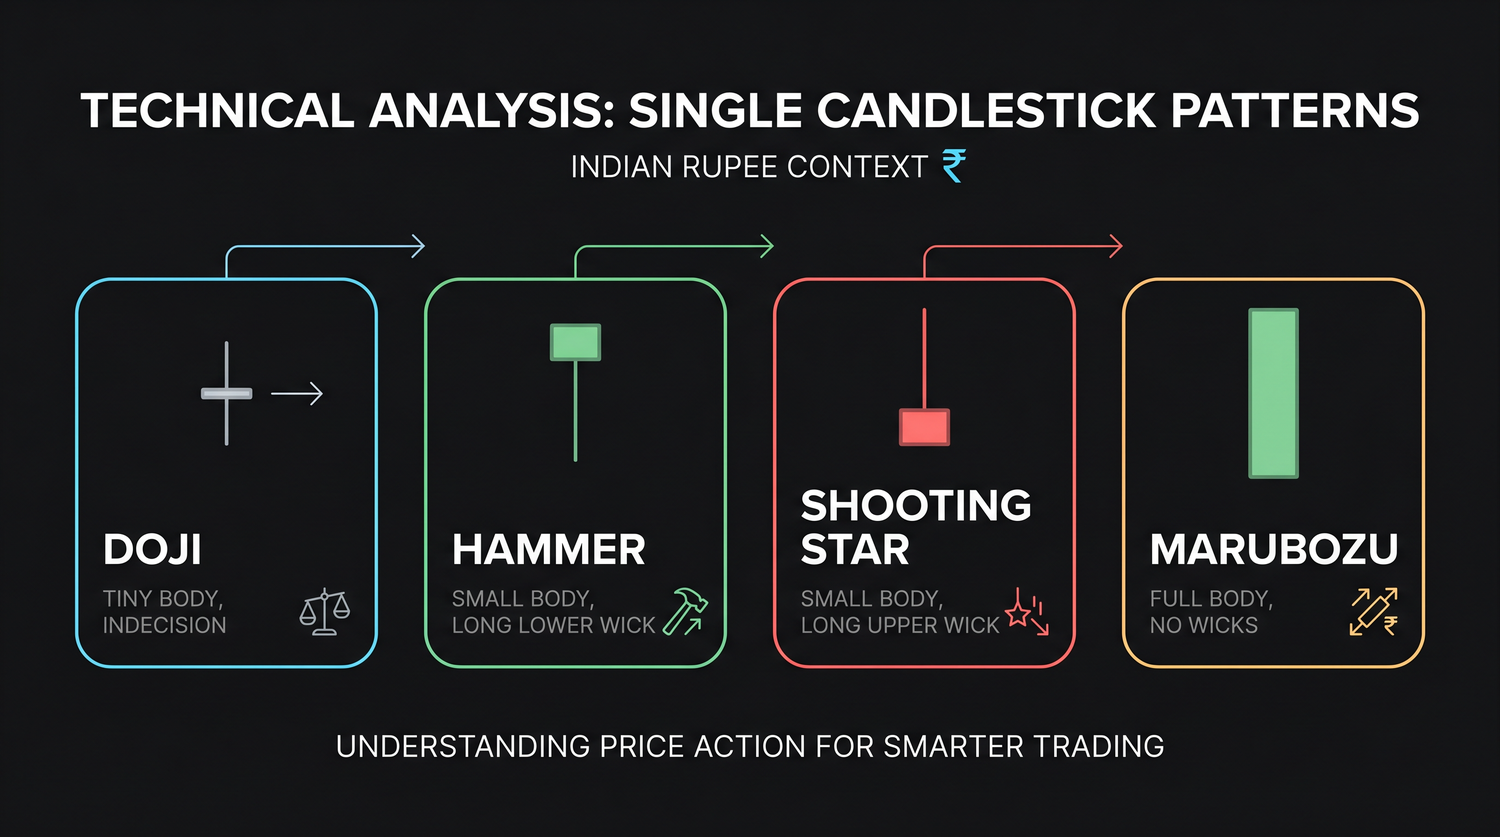
The doji, hammer, shooting star and marubozu, one candle that can flag a shift in control. Learn what each really means and find genuine examples on real NSE daily charts.
- ·Doji and indecision
- ·Hammer and hanging man
- ·Shooting star and inverted hammer
- ·Marubozu conviction
- ·Spinning tops
- ·What a single candle can and can't tell you
Imagine watching one full day of trading in a single stock and shrinking the whole thing down to one small picture. The picture would tell you where the price started the day, where it finished, and how far it travelled up and down in between. That picture exists. It is called a candlestick, and it is the basic building block of almost every chart a trader looks at.
Some candlesticks are loud. A long, solid shape says one side, buyers or sellers, took charge and never let go. Others are quiet. A tiny shape with long thin lines poking out of it says the price wandered far in both directions and then came back to where it began, with nobody really winning. This chapter is about the quiet, hint-dropping candles: the doji, the hammer, the shooting star, the marubozu and the spinning top. The one word to carry through the whole chapter is hint. A single candle is the first word of a sentence, not the whole story. Read on its own it tells you very little. Read in the right place, which is the job of the next two chapters, it can be the first real clue that control is changing hands.
First, the three parts of a candle
Every shape below is just a different arrangement of the same three measurements, so it pays to keep them straight.
- The body is the thick part of the candle. It stretches between the opening price, where the day started, and the closing price, where the day ended. A green, or hollow, body means the close was higher than the open, so buyers won the day. A red, or filled, body means the close was lower than the open, so sellers won.
- The wicks, sometimes called shadows, are the thin lines sticking out above and below the body. They reach up to the highest price of the day and down to the lowest. A wick marks ground that the price visited but could not hold onto.
- The range is the full height of the candle, from the very high down to the very low.
That is the whole vocabulary. The body shows who finished ahead, the wicks show where price got pushed back, and the range shows how wide the day's swing was. You do not need any special tool to see this. The four prices and a little plain arithmetic tell you everything: the body is the gap between the open and the close, the range is the high minus the low, and the wicks are whatever is left above and below the body.
The doji: a day that could not make up its mind
A doji is a candle whose open and close finish at almost exactly the same price, so the body shrinks to a thin horizontal line. The price may have swung around wildly during the day, but by the close neither buyers nor sellers had gained any ground. It is the chart drawing a shrug.
A doji is most interesting after a long run in one direction. If a stock has climbed for days on fat green bodies and then prints a doji, the steady buying has, for at least one day, stalled. That is not a signal to sell. It is a loss of momentum, the amount of push left behind a move, worth making a note of. There are named flavours too. A gravestone doji has a long upper wick with the open and close down near the low, showing buyers pushed the price up and got shoved straight back. A dragonfly doji has a long lower wick with the open and close up near the high, showing sellers pushed price down and got shoved back. Both are rejection stories that ended back where they started.
A doji means indecision, full stop. It does not say "reverse", it says "the side that was winning just paused." Whether that pause turns into a real turn or a brief rest depends entirely on what surrounds it. On its own, a doji is a question, not an answer.
The hammer and the hanging man: one shape, two meanings
A hammer has a small body near the top of the candle and a long lower wick, ideally twice the height of the body or more, with little or no upper wick. The story it tells: sellers dragged the price sharply down during the day, then buyers charged back in and pushed the close all the way up near the high. That long lower wick is selling that got rejected.
Now the catch that separates a beginner from a real chart reader. The very same shape means different things depending on where it shows up.
- After a downtrend, a stretch of falling prices, and near a support level, a price floor where buyers have stepped in before, that shape is a hammer. It hints that sellers are running out of steam and buyers are stepping in.
- After an uptrend, a stretch of rising prices, and near resistance, a price ceiling where sellers have capped things before, the identical candle is called a hanging man. It warns that sellers showed up during the day for the first time in a while, even though buyers managed to drag the close back up.
The candle is exactly the same. Only the context, the trend it sits inside, flips the meaning from hopeful to worrying. This is the single most important idea in candle reading, and it is the reason the next two chapters exist.
You cannot tell a hammer from a hanging man by looking at the candle alone. You have to know the trend it appears in. Anyone who calls a long-lower-wick candle "bullish" without checking what came before it is guessing. The wick shows rejection; the trend tells you rejection of what.
The shooting star and the inverted hammer: the upside-down version
Flip a hammer upside down and you get a small body near the bottom of the candle with a long upper wick. The same context rule decides what it means.
- After an uptrend, near resistance, it is a shooting star. Buyers pushed to a new high, then sellers slammed it back down to close near the low. A bearish, or downward-leaning, hint.
- After a downtrend, the same candle is an inverted hammer. Buyers tried to lift the price, and even though they faded by the close, the attempt itself shows demand waking up. A tentative bullish, or upward-leaning, hint.
The long upper wick is the key detail. It is buying that got rejected. In a long uptrend, that rejection is a small crack appearing in the floor of demand that has been holding the move up.
The marubozu: total conviction
The opposite of a doji is a marubozu, a long body with no wicks at all, or barely any. The price opened at one extreme and closed at the other and never looked back.
- A bullish marubozu opens at the low and closes at the high. Buyers controlled every minute.
- A bearish marubozu opens at the high and closes at the low. Sellers ran the whole day.
A marubozu is not an indecision candle, it is a conviction candle. It often shows up as a breakout bar, the candle on which price clears an important level and runs. Its message is momentum, not reversal: whatever direction it points, one side dominated completely, and that pressure frequently carries into the next day.
Picture a stock that has drifted sideways in a range for two weeks, then one day prints a big green marubozu that closes above the top of the range on heavy volume. That single candle is doing real work: it shows buyers overwhelmed the supply that had been capping the stock. Compare that to a doji on the same day, with the same range broken. A doji would say the breakout had no conviction behind it and might well fail. The shape itself is the information.
Spinning tops: a small body between two wicks
A spinning top has a small body sitting between two wicks of real length, one above and one below. Price ranged widely on both sides but closed near where it opened. Like the doji, it signals indecision and a tug-of-war with no winner, just with a bit more drama: both sides showed up and fought hard, and neither came out ahead.
A cluster of spinning tops after a strong trend is often the visual signature of a trend running low on fuel, the smooth one-way bodies giving way to choppy, undecided ones. Again, this is a heads-up to pay attention, not a reason to trade.
You can spot the indecision candles by comparing the body against the day's full range. A body smaller than about a tenth of the range marks a doji. A body smaller than roughly a third of the range, sitting between two clear wicks, marks a spinning top.
What a single candle can, and cannot, tell you
Be honest about the ceiling here. A single candle captures one day of buying and selling. That is genuine information: conviction, rejection and indecision are all real and readable. But one day is a tiny sample, and noise, random wiggles that mean nothing, is everywhere. The same hammer that marks a beautiful bottom on one chart marks absolutely nothing on a dozen others.
So what can one candle reliably tell you?
- Who won today, from the body's direction and size.
- Where price got rejected, from the wicks.
- Whether conviction is rising or fading, a marubozu versus a doji or spinning top.
What it cannot tell you on its own is what happens next. For that, the single candle has to be read together with the trend it sits in, the level it forms at, and the volume, the number of shares traded, behind it. A hammer floating in the middle of a flat, featureless drift is just a candle. A hammer at a tested support level, on heavy volume, after a clean downtrend, is a setup worth a closer look.
If you take just one thing from this chapter, take this: a single candle tells you who won today, never who wins the week. Treat any one shape as a gentle nudge to look closer, never as an instruction to buy or sell.
A single candle whispers; it never shouts a forecast. Its job is to flag that something may be changing and tell you who is in control right now. Turning that whisper into a decision needs context, and acting on a lone candle with no level, no trend and no volume behind it is the most common beginner mistake in all of charting.
Quick recap
- A doji (open and close almost equal) and a spinning top (small body, two wicks) both signal indecision, a pause in the prevailing pressure, not a reversal call.
- A hammer and a hanging man are the same shape (long lower wick); only the trend they appear in decides whether the meaning is bullish or bearish.
- A shooting star (in an uptrend) and an inverted hammer (in a downtrend) are the mirror image, a long upper wick showing rejected buying.
- A marubozu (full body, no wicks) is a conviction candle: momentum in one direction, often a breakout bar, the opposite of indecision.
- One candle reliably tells you who won today and where price got rejected, but never, by itself, what happens next.
Next we add a candle or two: the engulfing patterns, haramis and stars, where a small group of bars together tells a stronger story than any one of them alone.