Tops & Bottoms: Reversal Patterns
Head-and-shoulders, double tops and double bottoms, the classic shapes that mark the end of a trend. Learn how to spot them forming and measure a realistic target from a real example.
- ·Head and shoulders (and inverse)
- ·Double and triple tops/bottoms
- ·The neckline and the break
- ·Measuring a price target
- ·Volume through the pattern
- ·False reversals and traps
Every trend ends eventually. Not with a bell or an announcement, but usually with a shape: a stall, a failed push, a level that finally cracks under its own weight. Reversal patterns are the chart reader's attempt to give that ending a name before the rest of the crowd notices. The head and shoulders, the double top and the double bottom are the handful of formations that, when they appear in the right place, hint that control is quietly changing hands, from buyers to sellers or back again.
Carry one idea through this whole chapter: a pattern is a guess that has to be tested, not a verdict. The shape you spot is the start of a question, "is this trend running out of fuel?", and the market only answers it when a specific level breaks. Most half-formed reversals never complete. Many that look textbook-perfect still trap the people who jumped in early. So we will learn to draw these patterns carefully, measure them honestly, and treat every one as a setup that must prove itself before it earns a single rupee of risk.
What makes a pattern a reversal
A reversal pattern needs something to reverse. It forms at the end of a trend, a top after an uptrend, a bottom after a downtrend, and marks the point where the prevailing direction may be running out. That requirement matters more than the shape itself. A "double bottom" in the middle of a long sideways drift is just two lows. A double bottom after a hard, extended fall is a real candidate for a turn, because there was genuine selling pressure available to exhaust.
Three things turn a doodle into a tradeable reversal: a clear prior trend to reverse, a defined level whose break confirms the pattern (called the neckline), and follow-through after that break. Miss any one and you are looking at noise wearing a costume.
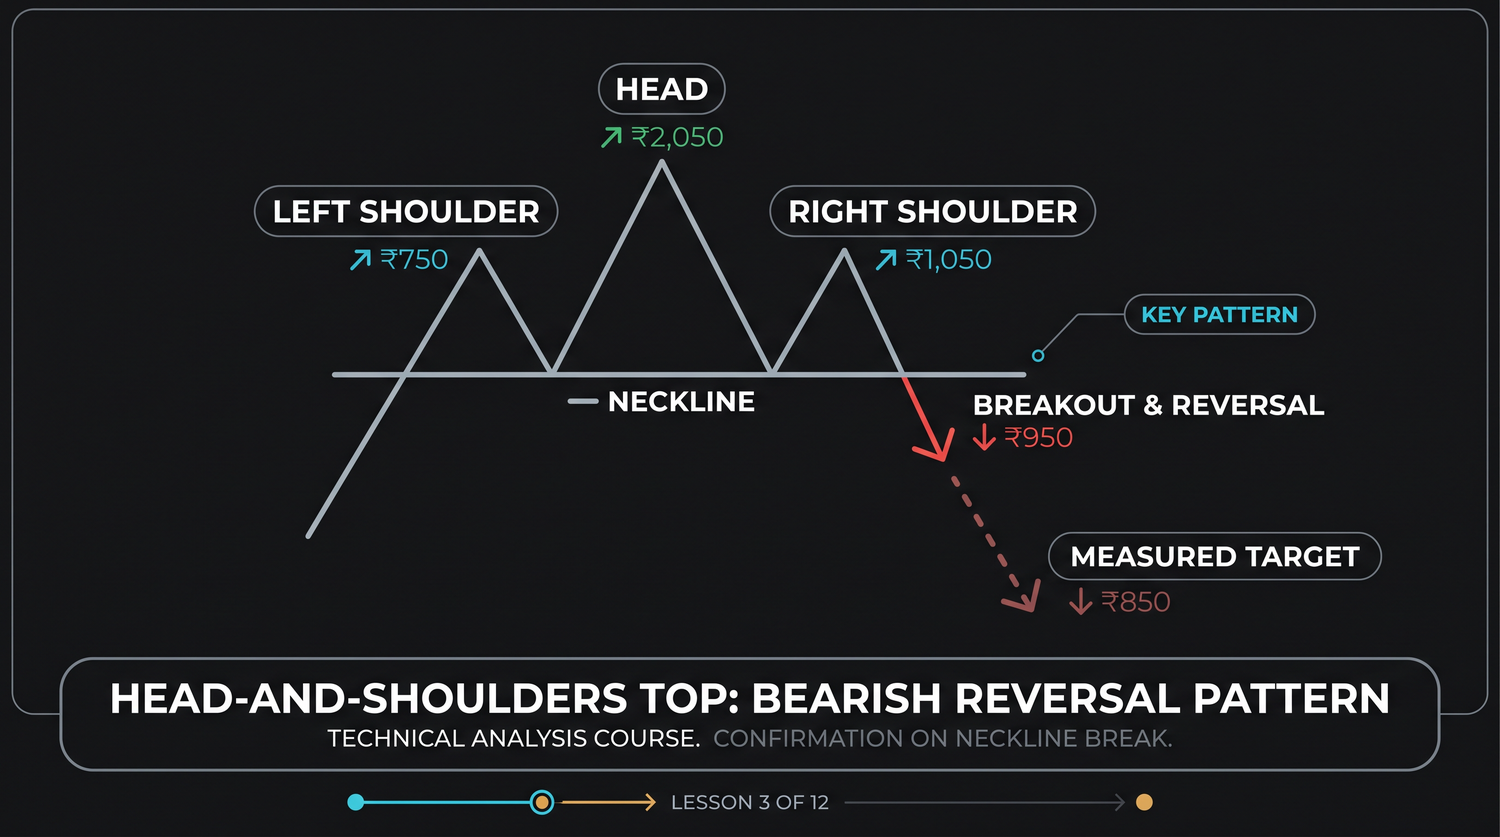
The head and shoulders
The head and shoulders is the most recognised top in technical analysis, and the easiest to over-spot. It has three pushes higher: a left shoulder, a higher head, and a right shoulder that fails to climb as high as the head. The two low points between those three peaks define the neckline, the line that, once broken, completes the pattern. The story is simple: buyers made one more high (the head), tried again, and could not get there (the right shoulder). That failure to make a higher high is the trend starting to bend.
The inverse head and shoulders is the same picture flipped over, forming at the bottom of a downtrend: a low, then a lower low (the head), then a higher low (the right shoulder), with a neckline overhead that confirms when price breaks up through it. Everything below about necklines, targets and volume applies to both, just mirrored.
The head and shoulders is the pattern most prone to wishful thinking. Almost any three-bump squiggle can be framed as one if you squint. Before you call it, insist on a real prior trend, a head that is clearly the highest peak, and a neckline you could have drawn before the right shoulder finished, not one fitted afterwards to make the pattern "work".
Double and triple tops and bottoms
A double top is the letter M: price rallies to a high, pulls back, rallies again to roughly the same high, and fails. The market tried twice to push through a level and got rejected twice, which means supply is sitting there. It is confirmed only when price breaks below the dip between the two peaks. A double bottom is the mirror, a letter W: two lows at a similar level with a bounce between them, confirmed when price breaks above the peak in the middle. Triple tops and bottoms are the same idea with one more test, rarer, and arguably stronger because the level held three times, but the trade-off is they take longer to confirm and the easy entry is often gone by the time they do.
Why does a second or third test matter? Because the first low only tells you where buyers stepped in once. When price returns and holds at the same level a second time, it shows that demand was not a one-off. There is a band of buyers willing to defend that zone, and sellers who could not push through it. The pattern is, at heart, a picture of supply being absorbed. That is also why a double bottom that forms after a deep, extended fall tends to carry more weight than one in a shallow dip: there was real selling pressure available to exhaust.
Here is a real one. Reliance Industries carved a textbook double bottom in 2022.
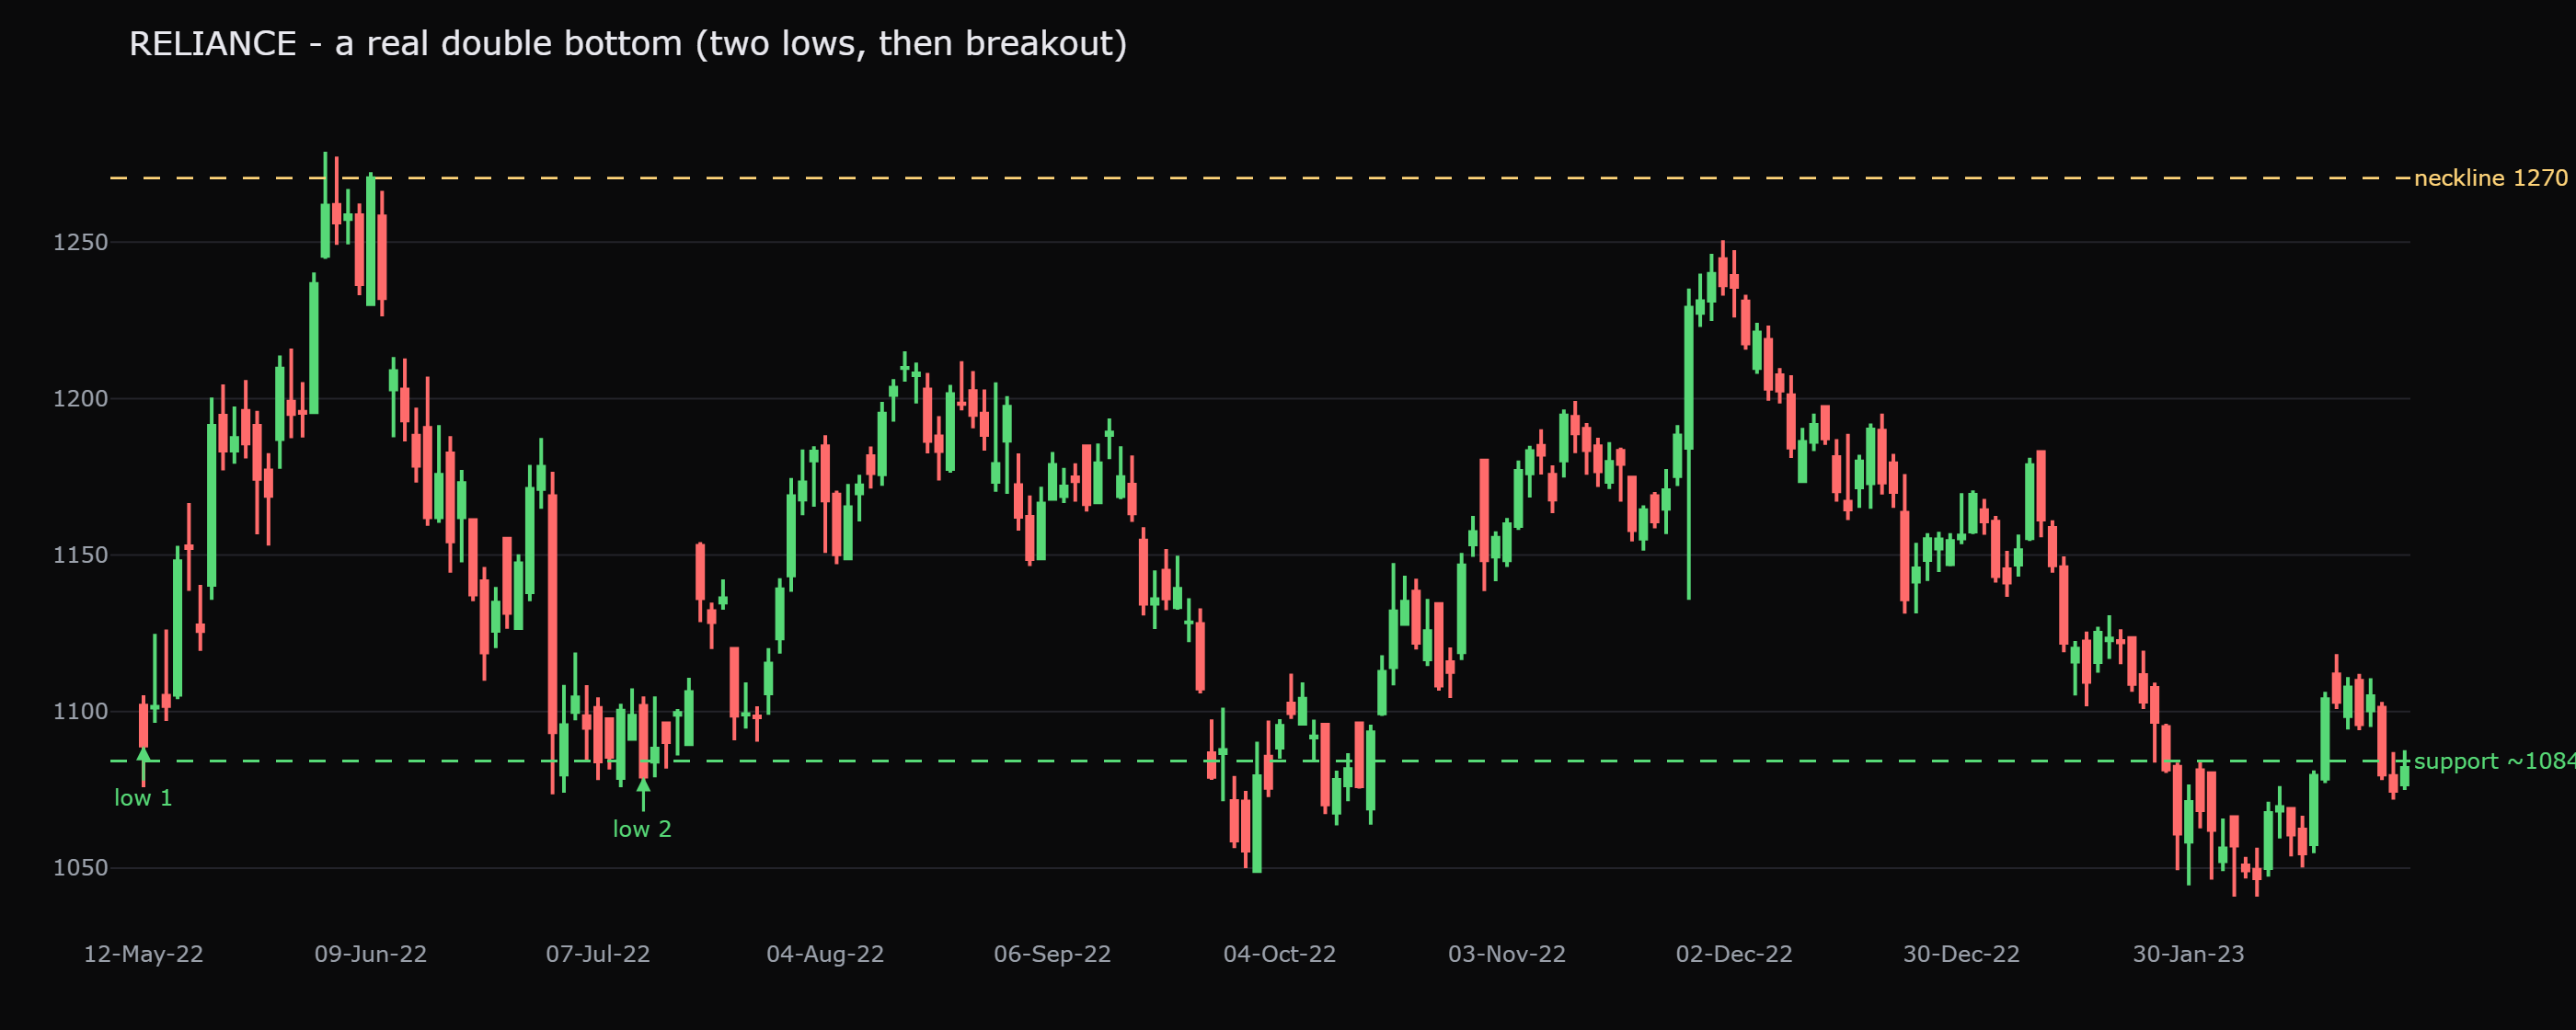
Reliance fell to 1089 on 12 May 2022, bounced, then dropped again to 1079 on 13 July 2022, two lows within about 1% of each other, two months apart. The peak between them sat near 1270, and that became the neckline. For weeks the chart was just two lows and a bounce; it was not a double bottom yet. The shape only confirmed when price pushed back up through 1270 and held. Notice the order: the pattern was named after the break, not before it.
The neckline is the whole pattern
It is tempting to act on the shape, to buy the second low of a double bottom or sell the right shoulder of a head and shoulders. Resist it. Until the neckline breaks, you do not have a reversal; you have a guess that the trend is ending, and trends end far less often than they appear to. The neckline break is the moment the market actually agrees with you. A close beyond the neckline, ideally a decisive one rather than a one-tick poke, is the signal. Everything before it is just anticipation.
And even the break is not a guarantee. A neckline break is, mechanically, a breakout, the moment price pushes past a key level, and breakouts fail often. Across the Nifty 50, 56% of 20-day breakouts slipped back below the breakout level within five days, a coin-flip-or-worse failure rate. When the break came on heavy volume, more than 1.5 times the recent average, the failure rate improved to 47%, and the moves that followed were better. Volume helps; it does not make the break safe.
This is why so many reversals turn into false reversals and traps. Price breaks the neckline, early sellers pile in, then it snaps back above, squeezing them out. Two defences: wait for a close beyond the neckline rather than an intraday spike, and accept the throwback, where price often returns to retest the broken neckline. That retest is frequently a cleaner, lower-risk entry than chasing the first break.
Measuring a target
These patterns come with a built-in, geometric way to set an objective: measure the height of the pattern and project it from the break. For a head and shoulders, that height is the vertical distance from the head down to the neckline. For a double bottom, it is the distance from the lows up to the neckline.
Take the Reliance double bottom. The neckline sat near 1270 and the lows near 1080, so the height is roughly 1270 minus 1080, which is about 190 points. Projected up from the neckline break, the measured target is about 1270 plus 190, which is roughly 1460.
A measured target is a planning number, not a prophecy. It tells you roughly how far the pattern "should" travel if it behaves, which lets you weigh the potential reward against the risk before you enter. Plenty of patterns stall halfway; some sail straight through. Use the target to size the trade and place a sensible stop, usually just back inside the pattern, never as a promise of where price must go.
Volume through the pattern
Volume, the number of shares traded, is the quiet confirmation underneath the shape. In a classic head and shoulders, volume is often heaviest on the left shoulder and the head, then noticeably lighter on the right shoulder. The last push up happens on fading participation, which is exactly the weakness the pattern is trying to expose. The most useful tell is on the break itself: a neckline break carries more weight when volume expands, because it shows real conviction rather than a thin drift across the line.
That said, treat volume as supporting evidence, not a gate. Indian single stocks have noisy volume, and plenty of valid breaks happen on unremarkable turnover. Use it to raise or lower your confidence, not as a pass-or-fail switch.
False reversals and the pattern-spotting trap
The honest reality is that most patterns you think you see never complete, and a fair share of the ones that do confirm still fail. The human brain is a pattern-finding machine. It will manufacture a head and shoulders out of random noise if you let it, a bias worth naming so you can catch yourself doing it. The antidote is the same checklist that runs through this whole course: does the pattern sit at a level that matters, does it fit or sensibly oppose the larger trend, did the confirming break come on decent volume, and is your risk defined before you act?
The one habit that matters most: a reversal pattern earns nothing on its own. It earns its keep when it lines up with a major support or resistance zone, a clear prior trend to exhaust, and a defined stop. The shape gets you to look; the context and the risk plan decide whether it is worth the trade.
Quick recap
- Reversal patterns mark the possible end of a trend: head and shoulders (and its inverse), double and triple tops and bottoms.
- Nothing is confirmed until the neckline breaks, preferably on a decisive close, with volume expanding.
- The measured target is the pattern's height projected from the break (Reliance's double bottom was about 190 points, projecting toward roughly 1460), a planning figure, not a guarantee.
- Volume typically fades into the right shoulder and should expand on the break, but it is supporting evidence, not a switch.
- Breaks fail often (56% of 20-day breakouts snapped back within five days; 47% even on high volume), so wait for confirmation, expect the retest, and define risk first.
Next up: not every consolidation is a turn. Many are just the trend pausing to breathe, the flags, pennants, triangles and rectangles we tackle next.