Inference & the Multiple-Testing Trap
Hypothesis tests, p-values, and why testing 500 ideas almost guarantees a fake winner.
- ·Sampling & estimates
- ·Hypothesis testing
- ·p-values, honestly
- ·The multiple-testing problem
- ·False discovery
- ·Why most backtests lie
The most dangerous thing in quantitative trading isn't a bad backtest - you throw those away. It's a beautiful one that you found by accident. Test enough ideas and randomness will hand you a strategy with a gorgeous equity curve and an impressive Sharpe ratio that is, underneath, pure noise. You'll believe it, fund it, and watch it die. This chapter is the immune system every quant needs: the statistics of not fooling yourself. It might be the most important chapter in the course.
Estimates are uncertain
Every number you compute from data - a win rate, an average return, a Sharpe - is an estimate from a limited sample, not the truth. Flip a fair coin ten times and you might see seven heads; that doesn't make it a 70% coin. The same is true of a strategy measured over a few months: the result you see is the true edge plus a large dose of luck, and from a small sample you genuinely cannot tell them apart. Holding that humility is the starting point of honest inference.
Hypothesis testing and p-values, honestly
Statisticians built a tool for exactly this question. You start by assuming the boring thing - the null hypothesis, that your strategy has no real edge and any profit is luck. Then you ask: if the null were true, how likely is a result this good? That probability is the p-value. A small p-value (say under 0.05) means "this would be a surprising fluke if there were no edge," which is weak evidence the edge might be real.
A p-value is not the probability your strategy works, and "p < 0.05" does not mean "real edge". It only says: if there were no edge, a result this strong would happen less than 5% of the time. Five percent is one in twenty - which becomes a disaster the moment you test more than twenty things.
The multiple-testing trap
And testing many things is exactly what quants do. Here's the trap made undeniable - we'll generate a thousand strategies that we know are pure noise (random coin-flip signals) and test them all on real Nifty:
# Test 1000 PURELY RANDOM strategies on real Nifty. Watch the luckiest one look brilliant.
import os
from datetime import datetime

import numpy as np
from openalgo import api

client = api(
    api_key=os.getenv("OPENALGO_API_KEY", "your_api_key_here"),
    host=os.getenv("OPENALGO_HOST", "http://127.0.0.1:5000"),
)

end = datetime.now().strftime("%Y-%m-%d")
r = client.history(symbol="NIFTY", exchange="NSE_INDEX", interval="D",
                   start_date="2021-01-01", end_date=end)["close"].pct_change().dropna().values

rng = np.random.default_rng(0)
N, days = 1000, len(r)
sharpes = np.empty(N)
for i in range(N):
    signal = rng.choice([1, -1], size=days)        # random long/short each day - pure noise
    strat = signal * r
    sharpes[i] = strat.mean() / strat.std() * np.sqrt(252)

print(f"Tested {N} purely RANDOM strategies on {days} days of Nifty.")
print(f"Mean Sharpe (should be ~0): {sharpes.mean():+.2f}")
print(f"Best  random Sharpe       : {sharpes.max():+.2f}")
print(f"Worst random Sharpe       : {sharpes.min():+.2f}")
print(f"\nThe 'best' strategy has a Sharpe of {sharpes.max():.2f} - and it is PURE LUCK. None has any edge.")Tested 1000 purely RANDOM strategies on 1356 days of Nifty. Mean Sharpe (should be ~0): +0.00 Best random Sharpe : +1.36 Worst random Sharpe : -1.32 The 'best' strategy has a Sharpe of 1.36 - and it is PURE LUCK. None has any edge.
Read that and let it sting. Not one of these strategies has any edge - they're literally random - yet the luckiest of the thousand sports a Sharpe of 1.36, the kind of number that gets a strategy funded. The average across all thousand is zero, exactly as it should be. But nobody reports the average; they report the best one they found. That single act - searching many ideas and keeping the winner - manufactures fake edges out of thin air.
The lucky tail
Plot all thousand and the danger lives in the right tail:
# The distribution of luck: 1000 noise strategies, and the lucky tail that fools you.
import os
from datetime import datetime
from pathlib import Path

import matplotlib

matplotlib.use("Agg")
import matplotlib.pyplot as plt
import numpy as np
import seaborn as sns
from openalgo import api

client = api(
    api_key=os.getenv("OPENALGO_API_KEY", "your_api_key_here"),
    host=os.getenv("OPENALGO_HOST", "http://127.0.0.1:5000"),
)

end = datetime.now().strftime("%Y-%m-%d")
r = client.history(symbol="NIFTY", exchange="NSE_INDEX", interval="D",
                   start_date="2021-01-01", end_date=end)["close"].pct_change().dropna().values

rng = np.random.default_rng(0)
N, days = 1000, len(r)
sharpes = np.array([(s * r).mean() / (s * r).std() * np.sqrt(252)
                    for s in (rng.choice([1, -1], size=days) for _ in range(N))])

sns.set_theme(style="whitegrid")
fig, ax = plt.subplots(figsize=(8, 4.5))
sns.histplot(sharpes, bins=40, color="#7c83ff", edgecolor="none", ax=ax)
ax.axvline(0, color="#555", lw=1)
ax.axvline(sharpes.max(), color="#dc2626", lw=1.8, label=f"luckiest = {sharpes.max():.2f} Sharpe")
ax.axvspan(1.0, sharpes.max() + 0.1, color="#dc2626", alpha=0.08)
ax.set_title("1000 random (zero-edge) strategies - and the lucky tail")
ax.set_xlabel("Annualised Sharpe ratio")
ax.set_ylabel("Number of strategies")
ax.legend()

out = Path(__file__).with_suffix(".png")
plt.savefig(out, dpi=110, bbox_inches="tight")
print(f"{(sharpes > 1).sum()} of {N} noise strategies cleared a 'great' Sharpe of 1.0 - by chance alone. Saved {out.name}")10 of 1000 noise strategies cleared a 'great' Sharpe of 1.0 - by chance alone. Saved 02_luck_distribution.png
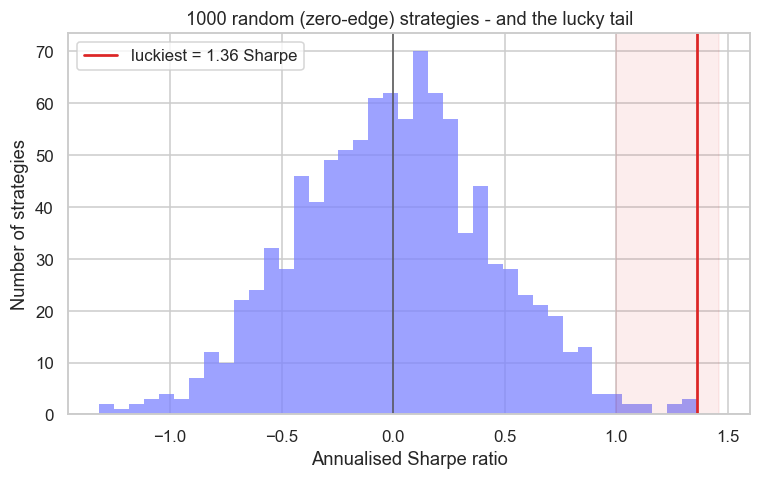
The whole distribution is centred on zero - no edge anywhere - but it has width, and that width is luck. Ten of the thousand cleared a Sharpe of 1.0, a level most traders would call excellent, purely by chance. The more strategies you test, the further into that lucky tail your "best result" is dragged. Your backtest didn't find an edge; your search found a coincidence.
Why most backtests lie
This is the quiet reason so many published and home-grown strategies fail live. The researcher tried fifty indicators, ten lookback windows, five thresholds - hundreds of combinations - and reported the one that shone:
Every survivor of that funnel is a coincidence wearing the costume of skill. The backtest isn't lying about the number; it's lying by omission - it never shows you the hundreds of variations that failed, so you mistake a selected fluke for a discovered truth.
Defending yourself
You can't avoid testing many ideas, but you can stop them fooling you:
- Hold out data. Find the idea on one period, then test it once on data it has never seen. Luck rarely survives a true out-of-sample test.
- Count your tries. Be honest about how many things you tested, and demand a much higher bar (a deflated Sharpe, a stricter p-value) the more you searched.
- Demand a reason. A real edge has an economic story - someone is paying it for a reason (risk borne, a structural quirk, a behavioural bias). A pattern with no why is probably a coincidence.
- Prefer fewer, deeper bets. One well-reasoned hypothesis tested cleanly beats a thousand-strategy fishing expedition every time.
The goal of inference isn't to find a winner - it's to avoid being fooled by one. Assume every beautiful backtest is luck until it survives out-of-sample data, an honest accounting of how hard you searched, and a real economic reason. Most won't. That scepticism is the single most valuable habit a quant can build.
Try it yourself
- Raise the number of random strategies from 1,000 to 10,000. Does the best Sharpe climb even higher? (It will - more tries, more extreme luck.)
- Split the Nifty history in half. Take the luckiest random strategy from the first half and test it on the second half. Does its Sharpe survive, or collapse toward zero?
- Count the variations in your own last strategy idea - every indicator, window and threshold you tried. How many tests was it really, and how much should that lower your confidence?
Recap
- Every metric is an estimate from a sample - the truth plus luck - and small samples can't separate the two.
- A p-value is the chance of a result this good if there were no edge - it is not the probability the strategy works, and "p < 0.05" is one-in-twenty.
- The multiple-testing trap: test enough zero-edge ideas and luck alone produces gorgeous winners - 1,000 random strategies gave a best Sharpe of 1.36.
- Most backtests "lie" by omission - reporting the selected fluke and hiding the hundreds of failures behind it.
- Defend yourself with out-of-sample testing, honest counting of your searches, an economic rationale, and fewer deeper bets - assume every pretty backtest is luck until proven otherwise.
We've seen that randomness can fake an edge. Next we ask whether prices themselves are predictable at all - the random walk, stationarity, and what the efficient-market hypothesis really claims about the game we're playing.