The Map of Indian Markets
NSE and BSE, cash and derivatives, the headline indices, and the cast of participants who move prices.
- ·NSE vs BSE
- ·Cash vs derivatives segments
- ·Nifty, Bank Nifty, FinNifty, Sensex
- ·Retail, HNI, FII/FPI, DII, prop
- ·Market-cap structure
- ·Reading who is trading
In Chapter 1 we measured Nifty and found it was barely more than a coin flip. But "the market" is not one number, and "Nifty" is just one window onto it. Before a quant can find an edge, they need the map - which arenas exist, which indices everyone watches, and crucially, whose orders actually move the price. Get this map wrong and you'll measure the wrong thing all day. Let's draw it.
The indices that run the show
A handful of indices set the mood for the entire Indian market. Here they are on one board, live:
# The indices everyone watches, on one board - the pulse of the Indian market.
import os

from openalgo import api

client = api(
    api_key=os.getenv("OPENALGO_API_KEY", "your_api_key_here"),
    host=os.getenv("OPENALGO_HOST", "http://127.0.0.1:5000"),
)

indices = [
    ("NIFTY", "NSE_INDEX"),       # the broad large-cap benchmark
    ("BANKNIFTY", "NSE_INDEX"),   # banks - the market's engine room
    ("FINNIFTY", "NSE_INDEX"),    # wider financials
    ("NIFTYIT", "NSE_INDEX"),     # the IT sector
    ("INDIAVIX", "NSE_INDEX"),    # the fear gauge
    ("SENSEX", "BSE_INDEX"),      # the BSE benchmark
]

print(f"{'INDEX':12s}{'LTP':>12s}{'DAY%':>9s}")
for sym, exch in indices:
    d = client.quotes(symbol=sym, exchange=exch)["data"]
    # change from the day's open (always meaningful, even after the close)
    pct = (d["ltp"] - d["open"]) / d["open"] * 100 if d.get("open") else 0
    print(f"{sym:12s}{d['ltp']:>12.2f}{pct:>8.2f}%")

print("\nDifferent indices, different stories - the market is never one thing.")INDEX LTP DAY% NIFTY 24021.65 0.95% BANKNIFTY 58150.35 1.88% FINNIFTY 26736.00 1.74% NIFTYIT 27566.70 1.92% INDIAVIX 13.39 -3.95% SENSEX 76991.22 1.00% Different indices, different stories - the market is never one thing.
Each one tells a different story. Nifty 50 is the broad large-cap benchmark. Bank Nifty is the engine room - banks are so heavily weighted that as they go, the market often goes. FinNifty widens that to all financials, Nifty IT tracks the tech exporters, and Sensex is BSE's 30-stock benchmark. Then there's the odd one out: India VIX, the "fear gauge."
Watch what India VIX did on this up day - it fell nearly 4% while every other index rose. That inverse relationship is no accident: VIX measures the price of fear (expected volatility), and fear gets cheaper when the market climbs calmly. We'll trade that relationship properly in Module E. For now, just notice that a quant reads VIX as a separate signal, not just another index.
Same market, many stories
Here's the trap in saying "the market was down this year." Which market? Rebase the big three indices to a common starting value of 100 and watch them pull apart:
# Same market, different stories: rebase three indices to 100 and watch them diverge.
import os
from datetime import datetime, timedelta
from pathlib import Path

import matplotlib

matplotlib.use("Agg")
import matplotlib.pyplot as plt
import seaborn as sns
from openalgo import api

client = api(
    api_key=os.getenv("OPENALGO_API_KEY", "your_api_key_here"),
    host=os.getenv("OPENALGO_HOST", "http://127.0.0.1:5000"),
)

end = datetime.now().strftime("%Y-%m-%d")
start = (datetime.now() - timedelta(days=365)).strftime("%Y-%m-%d")

sns.set_theme(style="whitegrid")
fig, ax = plt.subplots(figsize=(8, 4.5))
for sym, label, color in [("NIFTY", "Nifty 50", "#7c83ff"),
                          ("BANKNIFTY", "Bank Nifty", "#16a34a"),
                          ("NIFTYIT", "Nifty IT", "#e0852b")]:
    df = client.history(symbol=sym, exchange="NSE_INDEX", interval="D",
                        start_date=start, end_date=end)
    rebased = df["close"] / df["close"].iloc[0] * 100   # everyone starts at 100
    ax.plot(df.index, rebased, label=label, color=color, lw=1.6)
    print(f"{label:12s} 1-year return: {rebased.iloc[-1] - 100:+.1f}%")

ax.axhline(100, color="#9ca3af", ls="--", lw=1)
ax.set_title("One year, three indices - all rebased to 100")
ax.set_ylabel("Growth of 100 invested")
ax.legend()

out = Path(__file__).with_suffix(".png")
plt.savefig(out, dpi=110, bbox_inches="tight")
print("Saved", out.name)Nifty 50 1-year return: -4.1% Bank Nifty 1-year return: +3.0% Nifty IT 1-year return: -28.2% Saved 02_index_compare.png
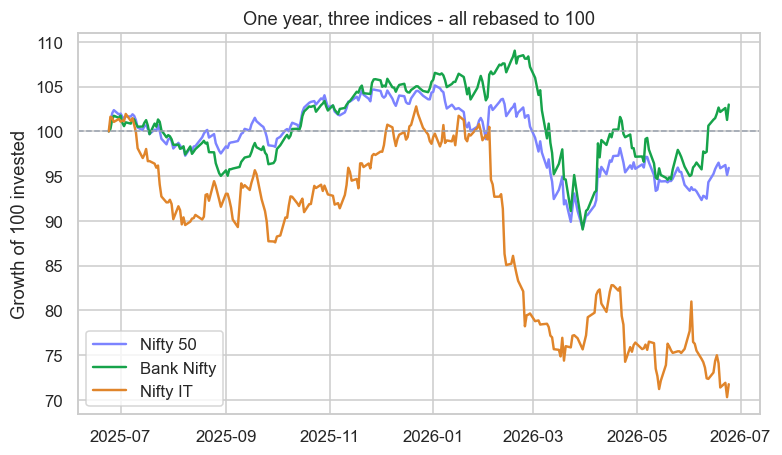
The dispersion is enormous. Over this window Bank Nifty rose while Nifty IT fell by more than a quarter - in the same economy, the same year. To a discretionary trader this is noise. To a quant it's the whole opportunity: when sectors fan out this much, you can be long the strong and short the weak and barely care which way the overall market goes. That single idea - trading the difference rather than the direction - is the seed of market-neutral strategies in Module G.
"The market" is a convenient fiction. Underneath it, sectors and stocks move on their own clocks. Quants live in that dispersion - the gaps between things are where most systematic edges hide.
Two exchanges, many segments
Almost everything you'll trade lives on three venues, and OpenAlgo gives each a clean exchange code you'll type constantly:
- NSE - the dominant exchange. Cash equity is
NSE; its huge derivatives segment isNFO; currency isCDS; indices areNSE_INDEX. - BSE - older, smaller in volume. Cash is
BSE, derivativesBFO, indicesBSE_INDEX. - MCX - commodities (crude, gold, natural gas), code
MCX.
So RELIANCE on NSE is the stock, NIFTY on NSE_INDEX is the index, and a Nifty future lives on NFO. That clean separation - learned properly in the symbol-format reference - is what lets one OpenAlgo script reach across the entire market without broker-specific quirks.
Who actually moves the price
Here's the part most charts hide. Every tick is the result of orders from very different players, each with different motives, sizes and speed:
- Retail traders - now a massive force, especially in options, where retail accounts for a huge share of volume.
- HNIs - high-net-worth individuals, often trading larger and through PMS structures.
- FII / FPI - foreign institutional investors. Their flows move large-caps; "FIIs sold today" is market-moving news for a reason.
- DII / mutual funds - domestic institutions, often the steady buyers that absorb FII selling.
- Prop desks & HFT - firms trading their own capital, frequently providing liquidity and arbitraging tiny gaps at high speed.
A quant doesn't just ask "where is the price going?" but "who is likely on the other side of my trade, and why?" An order resting in the book from a patient mutual fund is a very different animal from one fired by a latency-arbitrage bot. Reading flow - the subject of Module B - is a genuine edge.
Try it yourself
- Add
MIDCPNIFTYandNIFTYNXT50(bothNSE_INDEX) to the index board. How do mid-caps and the "next 50" compare to the headline Nifty today? - In the comparison chart, swap
NIFTYITforNIFTYPHARMA. Which defensive sector held up better over the year? - On a green market day, check India VIX again. Does it fall, as the fear-gauge logic predicts?
Recap
- A few indices set the tone: Nifty (large-cap), Bank Nifty (banks), FinNifty, Nifty IT, Sensex (BSE) - and India VIX, the fear gauge that moves inverse to the market.
- Beneath "the market" lies huge sector dispersion - one index can soar while another sinks in the same year - and trading that difference is the heart of market-neutral quant strategies.
- Trading lives on NSE, BSE and MCX, split into cash, derivatives, currency and commodity segments, each a clean OpenAlgo exchange code.
- Price is the meeting point of retail, HNIs, FII/FPI, DII/mutual funds and prop/HFT - and knowing who is on the other side is itself an edge.
Now that we have the map, we follow a single trade all the way through the system - from the moment you click buy to the cash and shares actually changing hands. That's the plumbing: SEBI, the exchanges, clearing and settlement.