Data & Research Infrastructure
The unglamorous backbone - tick vs bar data, point-in-time datasets, and the research-to-production pipeline.
- ·Tick / L1 / L2 / L3 data
- ·Point-in-time data
- ·Time-series databases
- ·Cleaning & corporate actions
- ·Research to production
- ·Reproducible pipelines
Behind every elegant strategy and clever model sits something deeply unglamorous: data infrastructure. It's the plumbing nobody brags about and everybody depends on - and it's where a startling number of quant ideas quietly die, not from a bad signal but from messy data, a survivorship leak, or a backtest no one can reproduce. This chapter is about the backbone: the kinds of data, the traps in storing it, and the pipeline that turns a research idea into a trustworthy, repeatable result.
The data hierarchy
Market data comes in resolutions, and the volume explodes as you zoom in. Watch how many bars a single day of Reliance produces at each interval:
# Data volume explodes as you go finer - why quants need real time-series databases.
import os
from datetime import datetime, timedelta
from pathlib import Path

import matplotlib

matplotlib.use("Agg")
import matplotlib.pyplot as plt
import seaborn as sns
from openalgo import api

client = api(
    api_key=os.getenv("OPENALGO_API_KEY", "your_api_key_here"),
    host=os.getenv("OPENALGO_HOST", "http://127.0.0.1:5000"),
)

end = datetime.now().strftime("%Y-%m-%d")
start = (datetime.now() - timedelta(days=6)).strftime("%Y-%m-%d")

counts = {}
for iv in ["D", "1h", "15m", "5m", "1m"]:
    df = client.history(symbol="RELIANCE", exchange="NSE", interval=iv,
                        start_date=start, end_date=end)
    last_day = df.index[-1].date()
    counts[iv] = int((df.index.date == last_day).sum())            # bars on one day

for iv, n in counts.items():
    print(f"  {iv:4s}: {n:>4d} bars per day")
print("  tick : thousands of bars per day (every trade) - the finest resolution")

sns.set_theme(style="whitegrid")
fig, ax = plt.subplots(figsize=(8, 4.5))
sns.barplot(x=list(counts.keys()), y=list(counts.values()),
            hue=list(counts.keys()), legend=False, palette="viridis", ax=ax)
for i, n in enumerate(counts.values()):
    ax.text(i, n + 2, str(n), ha="center", fontsize=10)
ax.set_title("Bars per day by resolution - data explodes as you zoom in")
ax.set_ylabel("Bars in one trading day")
ax.set_xlabel("Interval")
out = Path(__file__).with_suffix(".png")
plt.savefig(out, dpi=110, bbox_inches="tight")
print(f"\nFrom {counts['D']} daily bar to {counts['1m']} one-minute bars - and tick is far more. Saved {out.name}")D : 1 bars per day 1h : 7 bars per day 15m : 25 bars per day 5m : 75 bars per day 1m : 375 bars per day tick : thousands of bars per day (every trade) - the finest resolution From 1 daily bar to 375 one-minute bars - and tick is far more. Saved 02_resolution.png
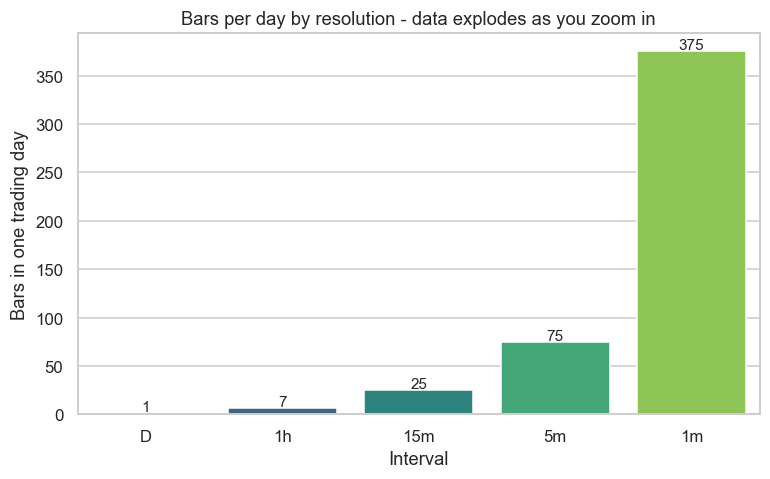
One daily bar becomes 375 one-minute bars - and tick data (every individual trade and quote update) is thousands per day, per instrument. There's a parallel hierarchy of depth: L1 (the best bid and ask), L2 (the full order book, Chapter 5), and L3 (every individual order). A single day of tick-and-L2 data across the whole market is gigabytes; years of it across thousands of instruments is the reason quant firms run serious data infrastructure rather than a folder of CSVs.
Data is messy
And raw data lies. Before you trust a single backtest, you must check the data's hygiene:
# Data hygiene: real market data is messy. Always run a quality check before trusting it.
import os
from datetime import datetime

import numpy as np
import pandas as pd
from openalgo import api

client = api(
    api_key=os.getenv("OPENALGO_API_KEY", "your_api_key_here"),
    host=os.getenv("OPENALGO_HOST", "http://127.0.0.1:5000"),
)

end = datetime.now().strftime("%Y-%m-%d")
df = client.history(symbol="RELIANCE", exchange="NSE", interval="D",
                    start_date="2019-01-01", end_date=end)
r = df["close"].pct_change()

# Business-day calendar gaps that aren't weekends (could be holidays or missing data)
expected = pd.bdate_range(df.index.min(), df.index.max())
missing = len(expected) - len(df.index.normalize().intersection(expected))

print(f"Rows                     : {len(df)}")
print(f"Date range               : {df.index.min().date()} -> {df.index.max().date()}")
print(f"Business days not present : {missing}  (holidays + any gaps)")
print(f"Zero-volume bars         : {(df['volume'] == 0).sum()}")
print(f"Duplicated timestamps    : {df.index.duplicated().sum()}")
print(f"Extreme moves (|ret|>20%): {(r.abs() > 0.20).sum()}  (bad ticks or corporate actions?)")
print(f"NaNs in close            : {df['close'].isna().sum()}")
print("\nNever feed raw data straight into a backtest - clean it, or your edge is a data artefact.")Rows : 1853 Date range : 2019-01-01 -> 2026-06-24 Business days not present : 108 (holidays + any gaps) Zero-volume bars : 0 Duplicated timestamps : 0 Extreme moves (|ret|>20%): 0 (bad ticks or corporate actions?) NaNs in close : 0 Never feed raw data straight into a backtest - clean it, or your edge is a data artefact.
This Reliance series is clean - zero bad ticks, no duplicates, no gaps in the trading record - but notice the 108 business days "not present": those are NSE holidays, not errors. That distinction matters. A naive script that assumes every business day is a trading day will silently misalign, and you need a proper holiday calendar to tell a real gap from a closed market. Other data isn't so kind - expect bad ticks (a fat-finger print at an impossible price), missing bars, duplicated timestamps and stale quotes. Cleaning is not optional; an uncleaned outlier is a backtest edge that doesn't exist.
Point-in-time data
Here's the subtle trap that ruins more institutional backtests than any other: data that's been revised since. To backtest honestly, you need point-in-time data - the world exactly as it looked on each historical date, before later corrections. The Nifty 50's membership as it was in 2020 (not today's list - that's survivorship, Chapter 32). A company's earnings as first reported, before restatements. Use today's revised numbers to backtest the past and you're trading on information that didn't exist yet - a leak as deadly as look-ahead.
Corporate actions
Prices need surgery too. When a stock does a 1-for-2 split, its price halves overnight - but that's not a −50% crash, it's an accounting event. Unless your data is adjusted for splits, bonuses and dividends, your returns series will be littered with fake catastrophic moves (this is exactly what the "extreme move" check above hunts for). Getting corporate-action adjustment right is unglamorous, fiddly, and absolutely essential - a single unadjusted split can fabricate or destroy an entire strategy's apparent edge.
Time-series databases and the pipeline
You store all this in time-series databases - specialised, columnar, compressed stores built for fast queries over billions of timestamped rows, not a general-purpose spreadsheet. And around it runs the research-to-production pipeline:
The crucial property of this pipeline is reproducibility: the same code, run on the same point-in-time data, must produce the same result, every time. Version your data and your code, so a backtest from six months ago can be reproduced exactly. And ideally the same code that ran the research runs in production - because a strategy that's reimplemented for live trading is a strategy whose live behaviour you can no longer trust.
Infrastructure is invisible until it fails - and then it fails your money. Clean your data, distinguish holidays from gaps, store it point-in-time to kill survivorship and revision leaks, adjust for corporate actions, and build a reproducible pipeline where the same code runs research and production. Glamorous it isn't; load-bearing it is.
Try it yourself
- Run the quality report on a stock that has had a split or bonus. Does an "extreme move" show up - and is it a real crash or an unadjusted corporate action?
- Build a tiny holiday calendar from the missing business days. How many NSE holidays were there per year?
- Take any earlier example and pin the exact data window and code version. Could a colleague reproduce your result exactly from that alone?
Recap
- Market data has a resolution hierarchy (daily to tick) and a depth hierarchy (L1/L2/L3) - and the volume explodes (1 daily bar to 375 one-minute bars, tick far more).
- Raw data is messy - bad ticks, gaps, duplicates - and you must distinguish real gaps from holidays with a proper calendar; clean before you trust.
- Point-in-time data (the world as it looked then, pre-revision) is essential to avoid survivorship and revision leaks.
- Corporate actions must be adjusted, or splits and bonuses masquerade as fake crashes.
- Store in time-series databases and run a reproducible research-to-production pipeline - same code, same data, same result.
We've now covered the entire craft - market, maths, models, strategies, rigor and infrastructure. The penultimate chapter steps back from the screen to the career: how to actually become a working quant in India.