Bulk Deals, Block Deals and Special Windows
How large players move size without wrecking the price - the bulk-deal and block-deal windows, disclosure rules, and what the prints tell a quant.
- ·Bulk vs block deals
- ·The block-deal windows
- ·Disclosure thresholds
- ·Reading bulk-deal data
- ·Negotiated trades
- ·What large prints signal
Somewhere in the last hour, a fund decided to exit two percent of a midcap. It had two choices. Feed the order into the continuous market a slice at a time and bleed impact cost all afternoon, or phone a counterparty, agree a single price, and cross the entire line in one negotiated print. Either way the tape remembers. Bulk deals and block deals are how genuinely large size changes hands in Indian equities, and learning to read their footprints is one of the cleanest microstructure skills a quant can own. They are also where you first feel the difference between the chart and what large players are actually doing.
Bulk versus block: same idea, two rule sets
Both are large trades, but they live in different places and obey different rules.
A bulk deal is any transaction, or set of transactions by one client, that adds up to more than 0.5% of a company's total listed equity shares in a single scrip on a single trading day. It happens in the ordinary continuous market, mixed in with everyone else's flow - there is no special venue. The only thing that makes it a "bulk deal" is its size relative to the float, and the disclosure it triggers: the broker must report the client name, quantity and weighted-average price to the exchange, which publishes a daily bulk-deals list. If the 0.5% line is crossed by a single trade, that disclosure is immediate (intraday); otherwise it goes out at end of day.
A block deal is different machinery. It is a single, pre-negotiated trade of large value executed in a dedicated block-deal window that sits outside the normal order book, so it does not disturb continuous price discovery. SEBI sets a minimum order value (currently of the order of Rs 10 crore, raised from an earlier Rs 5 crore) and pins the price to a narrow band around a reference. Crucially, a block deal must result in delivery - you cannot net it off intraday - and it too is disclosed by the exchange, typically within about half an hour of the window closing.
A bulk deal is defined by size (more than 0.5% of shares) and prints inside the normal market. A block deal is defined by venue (a separate negotiated window) and value (a large minimum set by SEBI). Both end up publicly disclosed - and that disclosure is the data you can mine.
The exact thresholds, the minimum block value, and the disclosure timing are all set by SEBI and the exchanges and have been revised over the years. Treat the structure as the durable part and look up the current figure when it matters; do not hardcode a number you read in a course into a compliance check.
The two block windows
Because a block deal is negotiated off the live order book, the exchange has to give it a fenced-off slot. There are two such windows in the trading day, and knowing them tells you exactly when large negotiated size is allowed to print.
The morning window runs roughly 08:45 to 09:00, before the pre-open auction. Its reference price is the previous day's close, and orders must sit within about plus or minus 1% of that reference. The afternoon window runs roughly 14:05 to 14:20, and its reference is the volume-weighted average price (VWAP) of the continuous-market trades in the preceding slice (around 13:45 to 14:00), again with a tight band around it. Two parties agree the size and price privately, enter matching orders into the window, and the exchange crosses them and then publishes the deal.
The negotiated-then-reported pattern is the whole point. The price is agreed off the live book so a Rs 100 crore cross does not blow a hole in the order ladder. But it is not secret: the disclosure follows, and within the hour the rest of the market knows a large hand moved. That gap between when the trade happened and when you learned about it is itself tradable information.
Negotiated block trades are sometimes loosely lumped together with "negotiated deals" in older market commentary. The modern, regulated path is the block-deal window with its reference-price band and mandatory delivery. Off-market private transfers exist for other purposes (gifts, pledges, inter-promoter transfers) but those are not the price-discovery prints we care about here.
Reading large prints from the tape
You will not find the bulk and block disclosure report hiding inside plain OHLCV history. What you can find is the footprint such a print leaves behind: a session where traded volume dwarfs the stock's own recent normal. The trick is choosing a baseline that does not itself get dragged up by the spike. A rolling median of recent volume is a good, robust choice - it ignores a single huge day rather than absorbing it the way a mean would.
# Detect candidate bulk/block activity: days when traded volume dwarfs the local median.
import os
from datetime import datetime, timedelta

import pandas as pd
from openalgo import api

client = api(
    api_key=os.getenv("OPENALGO_API_KEY", "your_api_key_here"),
    host=os.getenv("OPENALGO_HOST", "http://127.0.0.1:5000"),
)

SYMBOL, EXCHANGE = "SBIN", "NSE"
end = datetime.now().strftime("%Y-%m-%d")
start = (datetime.now() - timedelta(days=730)).strftime("%Y-%m-%d")
df = client.history(symbol=SYMBOL, exchange=EXCHANGE, interval="D",
                    start_date=start, end_date=end)

vol = df["volume"]
ret = df["close"].pct_change() * 100
med = vol.rolling(60, min_periods=30).median()      # a slow, participant-neutral baseline
mult = vol / med
flag = mult > 3.0                                    # a print 3x the usual = someone large showed up

flagged = pd.DataFrame({"volume_mn": (vol[flag] / 1e6).round(1),
                        "x_median": mult[flag].round(1),
                        "day_ret_pct": ret[flag].round(2)})

print(f"{SYMBOL} {EXCHANGE}: {len(df)} sessions, {int(flag.sum())} candidate bulk/block days "
      f"(volume > 3x 60-day median)\n")
print(flagged.tail(8).to_string())
top = mult[flag].idxmax()
print(f"\nHeaviest print: {top.date()} at {vol[top]/1e6:.1f}mn shares "
f"({mult[top]:.1f}x median) on a {ret[top]:+.2f}% day")SBIN NSE: 494 sessions, 7 candidate bulk/block days (volume > 3x 60-day median)
volume_mn x_median day_ret_pct
timestamp
2024-09-06 40.2 3.0 -4.43
2025-02-06 32.7 3.1 -1.80
2025-02-07 37.2 3.5 -2.00
2025-09-29 22.6 3.1 1.61
2026-02-09 40.9 5.0 7.46
2026-02-11 29.5 3.4 3.39
2026-02-12 33.2 3.8 0.80
Heaviest print: 2026-02-09 at 40.9mn shares (5.0x median) on a +7.46% dayOver 494 sessions of SBIN, only 7 days carried more than three times their own 60-day median volume - large prints are rare by construction, which is exactly what makes them worth flagging. The heaviest landed on 2026-02-09 at 40.9 million shares, a full 5.0x the median, on a +7.46% day, and it sat inside a tight cluster (09, 11 and 12 February) that smells like a catalyst pulling big participants in at once. Notice too that the older flagged days in September 2024 and February 2025 were down days. Heavy volume marks participation, not direction - a determined seller and a determined buyer both leave the same fat bar on the chart.
A volume spike is a proxy, not proof. It can be an index rebalance, a results day, an unwind, or genuine bulk and block activity - the tape alone cannot tell you which. The exchange's published bulk and block deals report is the ground truth; always confirm a candidate day against it before you believe a story about it.
What a large print actually signals
The interesting question is not "did a big trade happen" but "does it tell me anything about what comes next". A large informed buyer might be the leading edge of a move; a large seller might be capping it. So we measure, rather than assume: mark every candidate day and look at the stock's return over the following few sessions.
# Plot price and volume, mark candidate bulk/block days, and measure what price did next.
import os
from datetime import datetime, timedelta
from pathlib import Path

import matplotlib

matplotlib.use("Agg")
import matplotlib.pyplot as plt
import numpy as np
import seaborn as sns
from openalgo import api

client = api(
    api_key=os.getenv("OPENALGO_API_KEY", "your_api_key_here"),
    host=os.getenv("OPENALGO_HOST", "http://127.0.0.1:5000"),
)

SYMBOL, EXCHANGE, FWD = "SBIN", "NSE", 5
end = datetime.now().strftime("%Y-%m-%d")
start = (datetime.now() - timedelta(days=730)).strftime("%Y-%m-%d")
df = client.history(symbol=SYMBOL, exchange=EXCHANGE, interval="D",
                    start_date=start, end_date=end).reset_index(drop=True)

vol, close = df["volume"], df["close"]
med = vol.rolling(60, min_periods=30).median()
flag = vol > 3.0 * med                                # candidate bulk/block prints
fwd = close.shift(-FWD) / close - 1                    # return over the next FWD sessions

sns.set_theme(style="whitegrid")
fig, (axp, axv) = plt.subplots(2, 1, figsize=(10, 7), sharex=True,
                               gridspec_kw={"height_ratios": [2, 1]})
axp.plot(df.index, close, color="#7c83ff", lw=1.3)
axp.scatter(df.index[flag], close[flag], color="#dc2626", s=42, zorder=5,
            label="candidate bulk/block day")
axp.set_title(f"{SYMBOL} daily close - large prints and what price did next")
axp.set_ylabel("Close (Rs)")
axp.legend(loc="upper left")

axv.bar(df.index, vol / 1e6, color="#c7cad6", width=1.0)
axv.bar(df.index[flag], vol[flag] / 1e6, color="#dc2626", width=1.4)
axv.plot(df.index, 3 * med / 1e6, color="#16a34a", lw=1.1, label="3x 60-day median")
axv.set_ylabel("Volume (mn)")
axv.set_xlabel("Session number")
axv.legend(loc="upper left")
fig.tight_layout()

out = Path(__file__).with_suffix(".png")
plt.savefig(out, dpi=110, bbox_inches="tight")

after = fwd[flag].dropna()
base = fwd.dropna()
print(f"{int(flag.sum())} candidate days. Avg {FWD}-day forward return after a large print "
      f"{after.mean()*100:+.2f}% (median {after.median()*100:+.2f}%) vs all-day baseline "
f"{base.mean()*100:+.2f}%. Saved {out.name}")7 candidate days. Avg 5-day forward return after a large print +0.66% (median +1.07%) vs all-day baseline +0.27%. Saved 02_volume_spike_chart.png
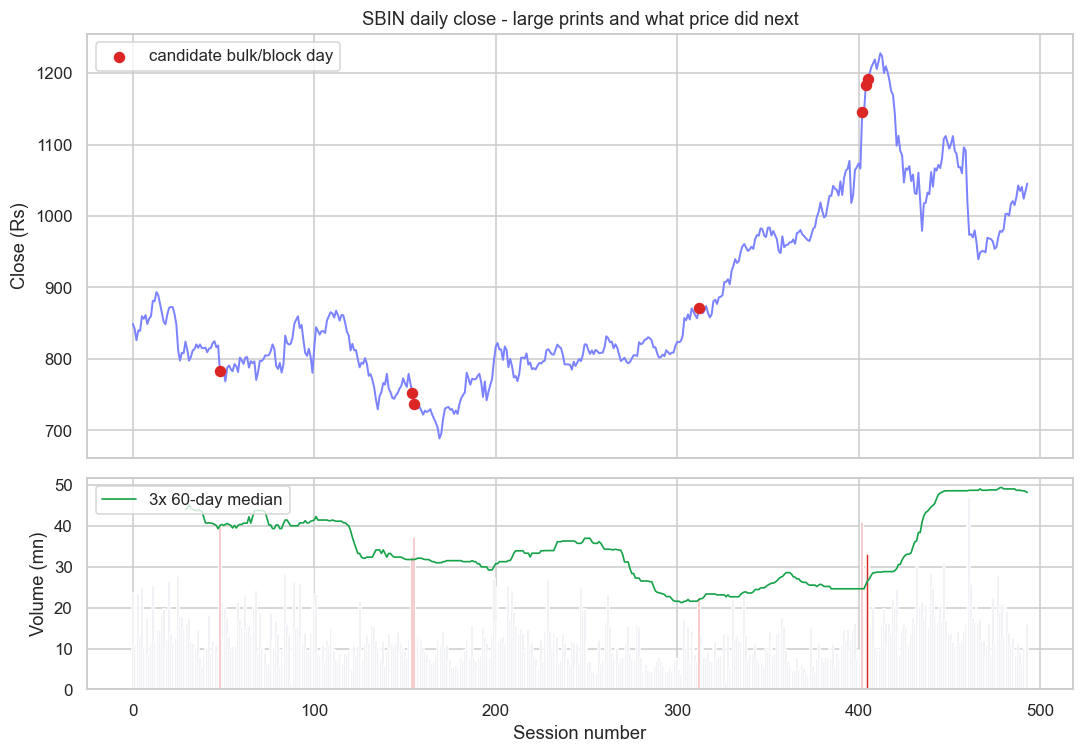
Across those 7 candidate days, SBIN's average 5-day forward return was +0.66% (median +1.07%), against an all-day baseline of +0.27%. So the prints did, on average, slightly precede strength - a real but modest tilt, and on a sample of seven it is a whisper, not a signal. That honesty is the lesson. The information in a large print is genuine but thin, it is conditional on who traded and why, and the edge that survives is usually about confirmation and context, not a mechanical "buy the volume spike" rule. A bulk buy by a long-only fund on a results beat reads very differently from a block exit by an exiting promoter, and the OHLCV bar looks identical for both.
Pair the footprint with the fact. When your scan flags a candidate day, pull the exchange bulk and block disclosures for that date and that scrip. Knowing the side (buy or sell), the counterparty type, and whether it was a window-crossed block or an open-market bulk turns a vague volume blob into a real, attributable event you can study.
Try it yourself
- Point the detector at a less liquid midcap and at a heavyweight like RELIANCE or HDFCBANK. Does the 3x-median threshold flag too much, or too little, as liquidity changes? You will likely need a per-stock threshold.
- Split the forward-return study by the sign of the day's return. Do up-day prints and down-day prints lead to different forward paths? That is the beginning of separating accumulation from distribution.
- Add intraday data (5-minute history) for a flagged day and see whether the volume arrived in the 14:05 to 14:20 afternoon window. A burst there is a strong hint of an actual block cross.
Recap
- A bulk deal is sized by float (more than 0.5% of listed shares) and prints in the normal continuous market; a block deal is a large-value, pre-negotiated trade crossed in a separate window and settled by delivery.
- There are two block windows: a morning one (around 08:45 to 09:00, referenced to the previous close) and an afternoon one (around 14:05 to 14:20, referenced to a recent VWAP), both held to a tight price band.
- Block trades are negotiated off the book, then reported - the disclosure lag is itself information.
- You can flag candidate large prints from history with a robust rolling-median volume baseline, but a spike marks participation, not direction, and is only a proxy for the real disclosure.
- The forward-return edge after a large print is real but small and noisy; the value comes from confirming it against the exchange's bulk and block report and reading the who and why.
Large prints tell you size moved. The next chapters in Module C make that idea precise: how much it costs to be that size, the economics of spread, depth and market impact, and the honest accounting of slippage when your own order is the one moving the price.