Live Trading System Design
The architecture of a running trading system - the OMS and PMS, the order and position lifecycle, state management and resilience under failure.
- ·OMS and PMS roles
- ·Order and position state
- ·Event loops and queues
- ·Idempotency and recovery
- ·BCP and disaster recovery
- ·Designing for failure
A trading strategy is the part you can write on a napkin. The live system is everything that keeps that napkin alive from 9:15 to 15:30 while the network drops packets, the exchange rejects an order, a process crashes halfway through a fill and your position is suddenly not what your code thinks it is. Most of the money lost by automated traders is not lost to a bad signal - it is lost to a system that did the wrong thing when something unexpected happened. This chapter is about the part that never shows up in a backtest: the machinery that turns a signal into orders, tracks what you actually own, and survives failure.
Two books: the OMS and the PMS
A live trading system has two distinct sub-systems that beginners often blur together. The OMS (Order Management System) owns the life of every order - from the moment you create it to the moment it reaches a terminal state. The PMS (Position Management System) owns the truth of every position - what you hold, at what average price, and what it is worth. The OMS thinks in orders; the PMS thinks in positions and profit and loss. Keeping them separate is not academic tidiness: an order and a position are different objects with different life cycles, and conflating them is how systems end up double-counting or losing track of risk.
The one event that crosses between the two books is a fill (a trade execution). The OMS receives a fill from the exchange, marks the order partially or fully done, and hands the fill to the PMS, which updates the position. Around both sits a risk layer that vets every order before it leaves, and underneath sits a recovery store that persists state so the system can rebuild itself after a crash. The thing that physically sends orders to the exchange and normalises the many broker APIs into one interface is the order gateway - OpenAlgo plays exactly this role, so your OMS speaks one protocol instead of one per broker.
Order state is a state machine
An order is never simply "sent". It moves through a small, strict set of states: pending (created locally, not yet acknowledged), submitted (the gateway has it), open (working at the exchange), partially filled, complete, or a terminal failure - cancelled, rejected or expired. The OMS is a state machine: each message from the exchange drives one transition, and the terminal states are absorbing - once an order is complete or rejected, nothing further can happen to it. A fill arriving on an order you already cancelled is not a normal event, it is a bug or a race, and the OMS must detect it rather than quietly apply it. Persist every transition as it happens, because that log is what you will rebuild from after a crash.
The OMS tracks orders, the PMS tracks positions, and a fill is the single event that crosses from one book to the other. Keep the two state machines separate and you can always answer the two questions that matter in a live system: what orders are live, and what do I actually hold.
Position state and realised P&L
The PMS holds just three numbers per instrument: the signed position, the average price of the open lot, and the realised P&L. The accounting is average-cost: a fill in the same direction re-weights the average, a fill in the opposite direction realises profit or loss at that average price, and a fill large enough to flip the position closes the old lot and opens the remainder at the new fill price. It is a few lines of code, but getting the flip and the average exactly right is the difference between a position book you can trust and one that silently drifts from the broker's.
The example below builds a tiny PMS class and walks a real build-and-unwind sequence through it, using the closes of recent RELIANCE daily bars as fill prices.
# A tiny PMS: apply real fills to a position and track size, average price and realised P&L.
import os
from datetime import datetime, timedelta

from openalgo import api

client = api(
    api_key=os.getenv("OPENALGO_API_KEY", "your_api_key_here"),
    host=os.getenv("OPENALGO_HOST", "http://127.0.0.1:5000"),
)


class PositionManager:
    """Average-cost position book. qty > 0 is a buy fill, qty < 0 a sell fill."""

    def __init__(self):
        self.position = 0     # signed quantity held
        self.avg = 0.0        # average price of the open position
        self.realised = 0.0   # realised P&L in rupees

    def apply(self, qty, price):
        same_way = self.position == 0 or (self.position > 0) == (qty > 0)
        if same_way:
            new_pos = self.position + qty
            self.avg = (self.avg * self.position + price * qty) / new_pos
            self.position = new_pos
        else:
            closing = min(abs(qty), abs(self.position))
            direction = 1 if self.position > 0 else -1
            self.realised += closing * (price - self.avg) * direction
            new_pos = self.position + qty
            self.position = new_pos
            if new_pos == 0:
                self.avg = 0.0
            elif (new_pos > 0) != ((self.position - qty) > 0):
                self.avg = price   # position flipped: remainder opens at fill price


# Real fill prices: the closes of recent RELIANCE daily bars.
end = datetime.now().strftime("%Y-%m-%d")
start = (datetime.now() - timedelta(days=20)).strftime("%Y-%m-%d")
bars = client.history(symbol="RELIANCE", exchange="NSE", interval="D",
                      start_date=start, end_date=end)
px = [round(float(p), 2) for p in bars["close"].tail(6)]

# A build-and-unwind sequence applied at those real prices.
fills = [("BUY", 100), ("BUY", 100), ("SELL", 150), ("SELL", 50), ("BUY", 200), ("SELL", 200)]

pms = PositionManager()
print(f"{'#':>2} {'side':>4} {'qty':>4} {'price':>9} {'position':>9} {'avg':>9} {'realised':>11}")
for i, ((side, q), price) in enumerate(zip(fills, px), 1):
    pms.apply(q if side == "BUY" else -q, price)
    print(f"{i:>2} {side:>4} {q:>4} {price:>9.2f} {pms.position:>9d} {pms.avg:>9.2f} {pms.realised:>11.2f}")

last = px[-1]
unreal = pms.position * (last - pms.avg)
print(f"\nFinal position {pms.position} | realised P&L Rs {pms.realised:.2f} | "
f"unrealised Rs {unreal:.2f} | total Rs {pms.realised + unreal:.2f}")# side qty price position avg realised 1 BUY 100 1328.10 100 1328.10 0.00 2 BUY 100 1309.50 200 1318.80 0.00 3 SELL 150 1326.50 50 1318.80 1155.00 4 SELL 50 1309.50 0 0.00 690.00 5 BUY 200 1313.60 200 1313.60 690.00 6 SELL 200 1318.10 0 0.00 1590.00 Final position 0 | realised P&L Rs 1590.00 | unrealised Rs 0.00 | total Rs 1590.00
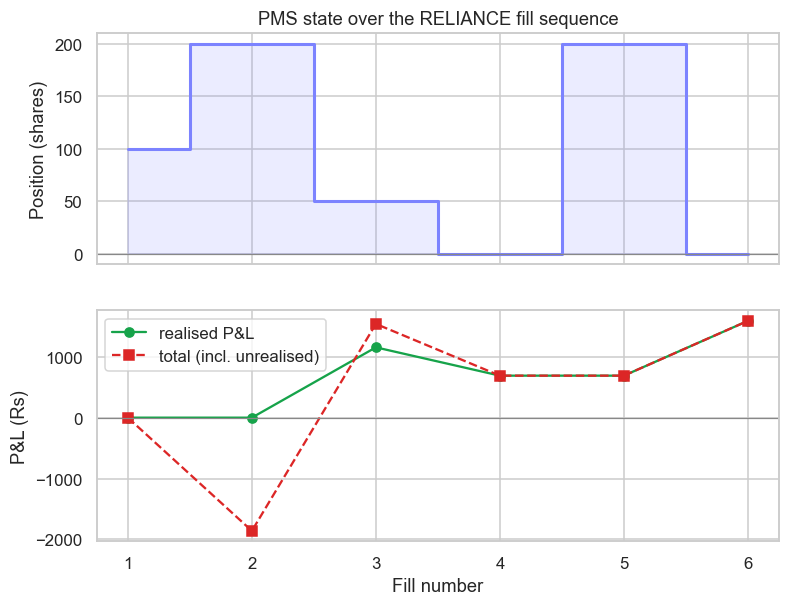
Read the run carefully. Two buys build a 200-share long at an average of Rs 1,318.80, the next two sells book Rs 1,155.00 and then give Rs 465.00 back, and a final round trip leaves the book flat with a realised P&L of Rs 1,590.00. The subtle point is the gap between realised and unrealised: after the second buy the book held 200 shares at Rs 1,318.80 while the market was at Rs 1,309.50, so the position was marked down by roughly Rs 1,860 even though nothing had been realised. That mark-to-market swing - not the tidy realised number - is what your risk layer must watch tick by tick.
Realised P&L is booked only when you reduce a position; unrealised P&L is the open position marked to the current price. A live risk system limits on the total (realised plus unrealised), because an open loss can breach a limit long before you ever close the trade.
The same state, charted across the fill sequence, makes the two curves visible - the position building and unwinding, and the P&L moving with it.
# Chart the PMS state: position size and P&L (realised + total) evolving over the fill sequence.
import os
from datetime import datetime, timedelta
from pathlib import Path

import matplotlib

matplotlib.use("Agg")
import matplotlib.pyplot as plt
import seaborn as sns
from openalgo import api

client = api(
    api_key=os.getenv("OPENALGO_API_KEY", "your_api_key_here"),
    host=os.getenv("OPENALGO_HOST", "http://127.0.0.1:5000"),
)


class PositionManager:
    def __init__(self):
        self.position, self.avg, self.realised = 0, 0.0, 0.0

    def apply(self, qty, price):
        same_way = self.position == 0 or (self.position > 0) == (qty > 0)
        if same_way:
            new_pos = self.position + qty
            self.avg = (self.avg * self.position + price * qty) / new_pos
            self.position = new_pos
        else:
            closing = min(abs(qty), abs(self.position))
            direction = 1 if self.position > 0 else -1
            self.realised += closing * (price - self.avg) * direction
            prev = self.position
            self.position = self.position + qty
            if self.position == 0:
                self.avg = 0.0
            elif (self.position > 0) != (prev > 0):
                self.avg = price


end = datetime.now().strftime("%Y-%m-%d")
start = (datetime.now() - timedelta(days=20)).strftime("%Y-%m-%d")
bars = client.history(symbol="RELIANCE", exchange="NSE", interval="D",
                      start_date=start, end_date=end)
px = [round(float(p), 2) for p in bars["close"].tail(6)]
fills = [("BUY", 100), ("BUY", 100), ("SELL", 150), ("SELL", 50), ("BUY", 200), ("SELL", 200)]

pms = PositionManager()
steps, pos, realised, total = [], [], [], []
for i, ((side, q), price) in enumerate(zip(fills, px), 1):
    pms.apply(q if side == "BUY" else -q, price)
    unreal = pms.position * (price - pms.avg)
    steps.append(i); pos.append(pms.position)
    realised.append(pms.realised); total.append(pms.realised + unreal)

sns.set_theme(style="whitegrid")
fig, (ax1, ax2) = plt.subplots(2, 1, figsize=(8, 6), sharex=True)
ax1.step(steps, pos, where="mid", color="#7c83ff", linewidth=2)
ax1.fill_between(steps, pos, step="mid", color="#7c83ff", alpha=0.15)
ax1.axhline(0, color="#888", linewidth=0.8)
ax1.set_ylabel("Position (shares)")
ax1.set_title("PMS state over the RELIANCE fill sequence")
ax2.plot(steps, realised, marker="o", color="#16a34a", label="realised P&L")
ax2.plot(steps, total, marker="s", color="#dc2626", linestyle="--", label="total (incl. unrealised)")
ax2.axhline(0, color="#888", linewidth=0.8)
ax2.set_ylabel("P&L (Rs)"); ax2.set_xlabel("Fill number"); ax2.legend()
out = Path(__file__).with_suffix(".png")
plt.savefig(out, dpi=110, bbox_inches="tight")
print(f"Fills {len(fills)} | final position {pos[-1]} | realised Rs {realised[-1]:.2f} | "
f"total Rs {total[-1]:.2f}. Saved {out.name}")Fills 6 | final position 0 | realised Rs 1590.00 | total Rs 1590.00. Saved 02_position_pnl.png
Event loops, queues and idempotency
Underneath the OMS and PMS runs an event loop: a single consumer pulls events - market-data ticks, order updates from the gateway, timers - off a queue and processes them one at a time. The single-threaded core is a deliberate design choice, not a limitation. Events arrive in an order, and applying them serially makes the system deterministic: the same sequence of fills produces the same position every time, which is exactly the property that lets your live engine match your backtest. Two threads racing to update the same position give you neither. Bound the queues so that a burst of data creates backpressure instead of unbounded memory growth.
The most expensive failure mode in live trading hides in this loop. You send an order and the network times out before you hear back. Did it reach the exchange or not? If you blindly resend, you may have just doubled your position. The defence is idempotency: every order carries a unique client order id, the gateway treats a resend with the same id as a no-op, and on a timeout you query the order's status rather than firing again.
Never blindly resend an order after a timeout. Attach a unique client order id to every order and, on any uncertainty, query state instead of re-sending. The duplicate order born from a naive retry is the classic way an algo turns a small glitch into a large, unwanted position.
Designing for failure: recovery and BCP/DR
Assume the process will crash mid-session - and design so that it does not matter. When it restarts, the in-memory position is gone, so the system must rebuild it. There are two sources of truth and they play different roles. Your own append-only event log in the recovery store records your intent and your fills; the broker's order book and positions are authoritative for what actually happened at the exchange. Recovery means replaying your event log to reconstruct state, then reconciling it against the broker before you resume trading - the broker wins on fills, your log wins on intent. Reconciliation is important enough to get its own chapter next.
Around all of this sits BCP/DR - business continuity and disaster recovery. That is the unglamorous discipline of a standby process or secondary site that can take over, heartbeats that detect a stalled engine, and a kill switch that can flatten or halt the book on command. The single principle that ties the whole design together is this: when the system is uncertain - an unknown order state, a stale feed, a failed reconciliation - the safe default is to stop trading, never to trade. A system that halts when confused loses a little; a system that trades when confused can lose everything.
Build the kill switch and the halt-on-uncertainty path first, before the strategy logic. The boring safety machinery is what separates a system you can run with real money from a clever script you have to babysit every second of the session.
We now have an engine that places orders, tracks positions and survives a crash. But a live system you cannot see is a live system you cannot trust. The next chapter moves to the control room: monitoring, the reconciliation break that reveals when your book and the broker's have drifted apart, and how to handle the incident when, inevitably, something breaks.