Execution Algorithms: VWAP, TWAP, POV and IS
How big orders are worked into the market without moving it - the scheduling algorithms and the implementation-shortfall framework behind them.
- ·Why slice large orders
- ·VWAP and TWAP
- ·Percentage of volume (POV)
- ·Implementation shortfall
- ·Almgren-Chriss intuition
- ·Choosing an execution algo
Every strategy in this module has been a liquidity taker - crossing the spread to get filled. But a signal is only half the job. How you turn that signal into a position can matter as much as whether the signal was right in the first place. Send a large order carelessly and you walk straight up the order book, paying more on every share and broadcasting your hand to everyone watching. A great idea, clumsily executed, is a losing strategy. This chapter is about the machinery that solves that problem: execution algorithms, the scheduling logic that works a big order into the market quietly, and the framework that measures whether it worked.
Why you cannot just send the order
When you trade in size, your own order moves the price. We met this as market impact in Chapter 25: a market order eats through the visible book level by level, each fill worse than the last, and the footprint it leaves nudges the price away from you. A clumsy execution can leak far more than brokerage and STT combined.
So a trader's true cost has two parts. Explicit costs are the visible ones: brokerage, STT, exchange fees, stamp duty. Implicit costs are the silent ones: the spread you cross, the impact you cause, and the delay cost of the price drifting while you wait. Execution algorithms exist to shrink the implicit costs, and to do that they all share one move - never send the whole order at once. You slice the parent order into many small child orders and feed them in over time, so each one is small enough to be absorbed by the natural flow.
VWAP and TWAP
To execute well you need a yardstick. The two standard benchmarks are VWAP and TWAP. Compute them on a real day of Reliance:
# VWAP and TWAP - the execution benchmarks every trading desk is measured against.
import os
from datetime import datetime, timedelta

from openalgo import api

client = api(
    api_key=os.getenv("OPENALGO_API_KEY", "your_api_key_here"),
    host=os.getenv("OPENALGO_HOST", "http://127.0.0.1:5000"),
)

end = datetime.now().strftime("%Y-%m-%d")
start = (datetime.now() - timedelta(days=6)).strftime("%Y-%m-%d")
df = client.history(symbol="RELIANCE", exchange="NSE", interval="5m",
                    start_date=start, end_date=end)
df = df[df.index.date == df.index[-1].date()]          # keep just the last trading day

df["typical"] = (df["high"] + df["low"] + df["close"]) / 3
vwap = (df["typical"] * df["volume"]).sum() / df["volume"].sum()
twap = df["close"].mean()

print(f"RELIANCE intraday, {len(df)} five-minute bars on {df.index[-1].date()}\n")
print(f"VWAP  : {vwap:.2f}   volume-weighted - more trades at a price, more weight (the benchmark)")
print(f"TWAP  : {twap:.2f}   time-weighted  - every bar counts equally")
print(f"Open  : {df['close'].iloc[0]:.2f}    Close: {df['close'].iloc[-1]:.2f}")
print("\nBeat VWAP and your execution desk earned its keep; lag it and you leaked money to the market.")RELIANCE intraday, 75 five-minute bars on 2026-06-24 VWAP : 1312.30 volume-weighted - more trades at a price, more weight (the benchmark) TWAP : 1313.22 time-weighted - every bar counts equally Open : 1306.30 Close: 1313.40 Beat VWAP and your execution desk earned its keep; lag it and you leaked money to the market.
VWAP, the volume-weighted average price, weights each price by how much volume traded there, so it reflects where the bulk of the day's business actually happened. It is the benchmark execution desks are judged against: buy below the day's VWAP and you added value; lag it and you leaked money. TWAP, the time-weighted average price, simply averages over time, treating every moment equally. The two differ here by about a rupee - the gap between "where most trading happened" and "the plain average".
Plot the running VWAP against the intraday price, with volume below, and you see the exact line a VWAP algo chases all day:
# Intraday price with its VWAP - the line a good execution algo tries to match.
import os
from datetime import datetime, timedelta
from pathlib import Path

import matplotlib

matplotlib.use("Agg")
import matplotlib.pyplot as plt
import seaborn as sns
from openalgo import api

client = api(
    api_key=os.getenv("OPENALGO_API_KEY", "your_api_key_here"),
    host=os.getenv("OPENALGO_HOST", "http://127.0.0.1:5000"),
)

end = datetime.now().strftime("%Y-%m-%d")
start = (datetime.now() - timedelta(days=6)).strftime("%Y-%m-%d")
df = client.history(symbol="RELIANCE", exchange="NSE", interval="5m",
                    start_date=start, end_date=end)
df = df[df.index.date == df.index[-1].date()].copy()

df["typical"] = (df["high"] + df["low"] + df["close"]) / 3
df["vwap"] = (df["typical"] * df["volume"]).cumsum() / df["volume"].cumsum()

sns.set_theme(style="whitegrid")
fig, (ax1, ax2) = plt.subplots(2, 1, figsize=(8, 6), sharex=True,
                               gridspec_kw={"height_ratios": [3, 1]})
ax1.plot(range(len(df)), df["close"], color="#7c83ff", lw=1.3, label="price")
ax1.plot(range(len(df)), df["vwap"], color="#dc2626", lw=2, label="running VWAP")
ax1.set_title(f"RELIANCE intraday vs VWAP ({df.index[-1].date()})")
ax1.set_ylabel("Price")
ax1.legend()
ax2.bar(range(len(df)), df["volume"], color="#16a34a", alpha=0.5)
ax2.set_ylabel("Volume")
ax2.set_xlabel("5-minute bar of the day")

out = Path(__file__).with_suffix(".png")
plt.savefig(out, dpi=110, bbox_inches="tight")
print(f"Final VWAP {df['vwap'].iloc[-1]:.2f}, close {df['close'].iloc[-1]:.2f}. Saved {out.name}")Final VWAP 1312.30, close 1313.40. Saved 02_execution_chart.png
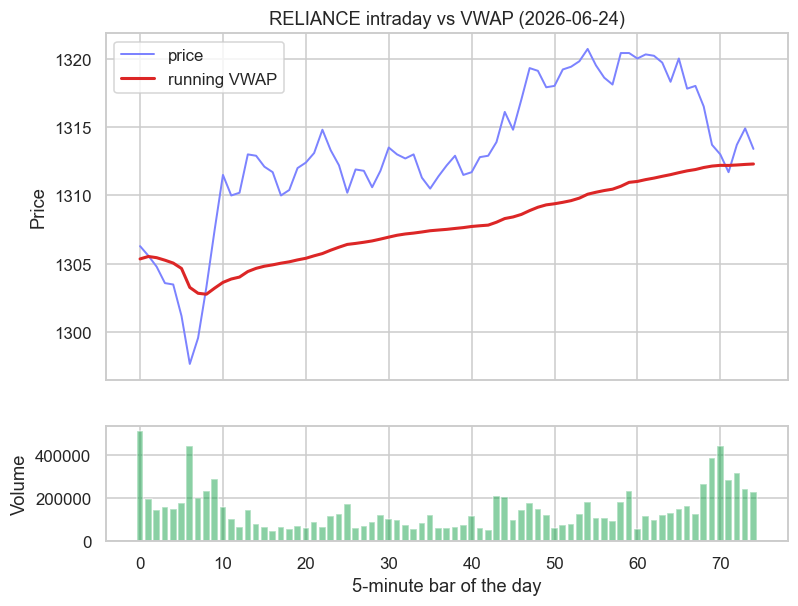
The VWAP line is smooth and anchored - it barely moves on quiet bars and shifts on the busy ones. An algo trying to "achieve VWAP" simply trades a little more whenever volume is high, so its own fills land right on that line.
A strategy's paper returns assume perfect fills. Real returns are paper returns minus execution cost. Benchmark a buy against the day's VWAP, and remember that a "profitable" backtest can die entirely in the gap between the decision price and the actual fill.
Slicing and the scheduled algos
So how do you actually land near VWAP on a large order? You break the parent into small child orders dribbled out across the session:
This gives the first family of execution algos, the scheduled ones, which decide in advance how to spread the order across the day:
- A VWAP algo sizes each slice to match the day's expected volume profile - more when the market is usually busy (the open and the close), less in the quiet midday lull - so its average fill tracks VWAP.
- A TWAP algo ignores volume and spreads the slices evenly over time. It is the right choice when you have no reliable volume forecast, or when you deliberately want a predictable, steady footprint.
Both hide a large order inside the natural flow so it gets absorbed rather than announcing itself and moving the price against you.
Percentage of volume
A scheduled algo commits to a plan and can be caught out if the day's volume is nothing like the forecast. The alternative is to react to live volume. A percentage-of-volume (POV) algo, also called a participation algo, targets a fixed share of whatever is trading right now - say 10% of market volume. When the market is active it trades faster; when volume dries up it slows down, automatically. You never become an outsized fraction of the tape, so your impact stays roughly constant relative to everyone else.
The cost of that adaptiveness is losing control over when you finish. In a quiet market a POV order may never complete; in a sudden burst it may fill far faster, and larger, than you intended, which is its own way of showing your hand.
Match the algo to your constraint. If you must be done by the close, a scheduled VWAP or TWAP guarantees completion. If you care more about not being a conspicuous share of the flow, POV keeps your footprint proportional but leaves your finish time at the mercy of the market.
Implementation shortfall and the Almgren-Chriss trade-off
VWAP measures you against the day, but there is a stricter, more honest metric. Implementation shortfall (IS) is the gap between the price when you decided to trade and the price you actually achieved, counting everything: spread, impact, fees, and the cost of delay as the market drifts away while you slice slowly. It is the real, all-in cost of turning a decision into a position.
IS forces the central trade-off of execution into the open. Trade fast and you minimise the risk of the price running away, but you pay heavy market impact. Trade slow and you keep impact low, but you expose yourself to timing risk - the price wandering on you over the hours you take. You cannot escape both at once.
The Almgren-Chriss framework makes this precise. It models execution cost as the sum of two opposing terms: market impact, which rises the faster you trade, and timing risk (price volatility over the execution window), which rises the slower you trade. Plotting expected cost against risk traces an efficient frontier of execution schedules, exactly like the risk-return frontier of portfolio theory. Where you sit on it is set by one dial: your risk aversion. An urgent, risk-averse trader front-loads the schedule and accepts impact to cut timing risk; a patient one stretches the order out to save impact and tolerates the volatility. An IS algo simply solves for the optimal schedule given your urgency.
Carry the Almgren-Chriss result as a shape, not a formula: faster execution costs more in impact but less in risk, slower the reverse, and a single risk-aversion parameter picks the balance. It is the same efficient-frontier logic you met in portfolio construction, applied to the time axis of a single order.
Choosing an execution algo
There is no universally best algo, only the right tool for the constraint in front of you.
| Algo | Benchmark / goal | Best when |
|---|---|---|
| TWAP | Plain time average | No reliable volume forecast; want a steady, predictable footprint |
| VWAP | The day's VWAP | Large order over a full session, judged against VWAP |
| POV | Fixed share of volume | Want impact proportional to flow; flexible on finish time |
| IS / Almgren-Chriss | The decision price | Urgency matters; trade off impact against timing risk explicitly |
The most expensive execution is usually the impatient one. Crossing the spread for the whole order at once guarantees you the worst price in the book and the largest impact. Unless you have genuine information that will move the price within seconds, slicing almost always beats dumping.
A final step closes the loop: transaction cost analysis (TCA) measures every real execution against VWAP and implementation shortfall, so you can see where you leak and feed that back into the choice of algo. TCA is to execution what backtesting is to strategy - the measurement that turns a guess into a process.
Where this leaves you, and what comes next
Everything in this chapter has been about taking liquidity gracefully - getting your order filled near a fair price without moving it. The mirror image is providing liquidity: standing in the market quoting both a bid and an ask, earning the spread as the fee for letting others trade now. That business has its own defining risk, the inventory you are left holding and the adverse selection that comes with it. That is the subject of the next chapter, ch38 on market making and inventory risk, which completes this module's tour of how orders actually meet the market.