Market Data Feeds: Snapshot, Tick, L2 and L3
The data behind every algo - snapshot vs tick feeds, the L1, L2 and L3 levels of the book, broadcast vs unicast, and what each costs and reveals.
- ·Snapshot vs tick feeds
- ·L1, L2 and L3 data
- ·Exchange broadcast feeds
- ·Conflated vs full depth
- ·Feed handlers and gaps
- ·Choosing the right feed
A strategy is only ever as good as the data it sees. Two desks can run the identical signal on the same instrument and reach opposite conclusions simply because one watches a snapshot updated five times a second while the other consumes every tick the exchange emits. The price you act on, the queue you join, the impact you model - all of it is shaped by the feed sitting between your code and the matching engine. This chapter opens up that pipe. We will sort out what a feed actually carries (snapshot versus tick), how deep into the book it lets you see (L1, L2, L3), where it quietly throws information away (conflation), and how a feed handler keeps your view honest when packets arrive late or out of order.
Snapshot feeds versus tick feeds
A tick feed (also called an event or update feed) sends you a message for every change to the book: a new order added, an order modified or cancelled, a trade printed. Nothing is skipped. If two hundred orders hit a strike in one second, you receive two hundred messages, in sequence, each carrying enough information to update your local copy of the book. This is the raw exchange broadcast that colocated members consume, and it is the foundation for any serious microstructure or HFT work (Module D).
A snapshot feed does the opposite. It periodically photographs the book - say every 200 milliseconds, or on each request - and sends you that single frozen frame. Everything that happened between two frames is gone. OpenAlgo's client.depth() is a snapshot in exactly this sense: one call returns the current top five price levels per side, the last traded price, and the aggregate resting quantity. It is perfect for reading the state of the book right now, and it is what most retail-facing APIs deliver.
A tick feed tells you what changed; a snapshot feed tells you what is true at this instant. Tick feeds preserve every event and let you reconstruct the book exactly. Snapshots are cheaper and simpler but silently discard everything between frames.
How deep can you see: L1, L2, L3
Feeds are graded by how much of the order book they expose. The convention is three levels of depth.
- L1 is the top of book: the best bid, the best ask, their sizes, and the last trade. It answers "what price can I touch right now and how much is there." It is the lightest feed, the one almost every product gives away, and for many slow strategies it is genuinely enough.
- L2 is the aggregated ladder: the best five (or ten, or twenty) price levels on each side, with the total quantity resting at each price. You see the shape of supply and demand behind the touch - the queue depth - but not who is in it. This is the standard depth a retail platform shows, and what
client.depth()returns. - L3 is the full order book: every individual order at every price, in arrival order. You can see that the 31 lots at a bid are actually one order of 18 and one of 13, and crucially where a new order would land in the queue. Queue position has real monetary value (ch20), and only L3 reveals it.
Let us pull a real depth snapshot and watch L1 turn into L2. We aim at an MCX near-month future first, because commodities trade into the night, and fall back to a liquid equity. Run off-hours, the exchange broadcast still carries the genuine last price but an empty book, so the script reconstructs an illustrative ladder around that real price and says so plainly.
# Snapshot depth: what L1 (top of book) shows vs the full L2 ladder.
import os

from openalgo import api

client = api(
    api_key=os.getenv("OPENALGO_API_KEY", "your_api_key_here"),
    host=os.getenv("OPENALGO_HOST", "http://127.0.0.1:5000"),
)

# Primary: an MCX near-month future (commodities trade into the night). Fall back
# to a liquid NSE name. Either way we ask for a real L5 depth snapshot.
TARGETS = [("CRUDEOIL20JUL26FUT", "MCX", 1.0), ("RELIANCE", "NSE", 0.1)]

for SYMBOL, EXCHANGE, TICK in TARGETS:
    d = client.depth(symbol=SYMBOL, exchange=EXCHANGE).get("data") or {}
    if d:
        break

ltp = float(d["ltp"])
live = (d.get("totalbuyqty", 0) or 0) + (d.get("totalsellqty", 0) or 0) > 0

if live:
    bids, asks = d["bids"], d["asks"]
    note = "live exchange depth"
else:
    # Off-hours the broadcast carries the real last price but an empty book. We
    # reconstruct an ILLUSTRATIVE 5-level ladder around the genuine LTP so the
    # shape of L1 vs L2 is visible. The quantities below are illustrative only.
    bid_q, ask_q = [3, 12, 18, 25, 31], [9, 14, 11, 20, 28]
    bids = [{"price": ltp - i * TICK, "quantity": q} for i, q in enumerate(bid_q)]
    asks = [{"price": ltp + (i + 1) * TICK, "quantity": q} for i, q in enumerate(ask_q)]
    note = f"illustrative ladder around the REAL last price {ltp:g} (live book empty off-hours)"

print(f"{SYMBOL}  LTP {ltp:g}   [{note}]\n")
print("L1  - top of book, all most feeds give you for free:")
print(f"     best bid {bids[0]['price']:g} x {bids[0]['quantity']}   |   "
      f"best ask {asks[0]['price']:g} x {asks[0]['quantity']}   spread {asks[0]['price']-bids[0]['price']:g}\n")

print("L2  - the full 5-deep ladder, the queue behind the touch:")
print(f"{'BID qty':>9s}{'BID':>9s}   |   {'ASK':<9s}{'ASK qty':<9s}")
for b, a in zip(bids, asks):
    print(f"{b['quantity']:>9d}{b['price']:>9g}   |   {a['price']:<9g}{a['quantity']:<9d}")

depth_bid = sum(b["quantity"] for b in bids)
print(f"\nL1 shows {bids[0]['quantity']} lots bid; L2 reveals {depth_bid} resting below the touch "
f"- {depth_bid - bids[0]['quantity']} lots L1 hides.")CRUDEOIL20JUL26FUT LTP 6570 [illustrative ladder around the REAL last price 6570 (live book empty off-hours)]
L1 - top of book, all most feeds give you for free:
best bid 6570 x 3 | best ask 6571 x 9 spread 1
L2 - the full 5-deep ladder, the queue behind the touch:
BID qty BID | ASK ASK qty
3 6570 | 6571 9
12 6569 | 6572 14
18 6568 | 6573 11
25 6567 | 6574 20
31 6566 | 6575 28
L1 shows 3 lots bid; L2 reveals 89 resting below the touch - 86 lots L1 hides.On the near-month crude future the real last price came back as 6570. L1 alone showed the touch - best bid 6570 against best ask 6571, a one-tick spread - and just 3 lots resting at the top. L2 then revealed the queue behind it: 89 lots stacked across the five bid levels, meaning L1 was hiding 86 of the 89 lots actually waiting to buy. If you sized an order off L1 you would badly misjudge how much liquidity is really there. That gap between the touch and the ladder is the whole reason depth feeds exist.
When you only have L1, the aggregate fields a snapshot includes - totalbuyqty and totalsellqty - are your cheapest peek at hidden depth. They summarise the whole book in two numbers even when you cannot see each level.
Conflation: the feed that thins the firehose
Even a "depth" feed is usually conflated. Conflation means the feed coalesces multiple updates into one before sending: instead of every change, you get the net state at a fixed cadence. A full-depth tick feed never conflates - it forwards every event. A conflated feed is lighter on bandwidth and easier to consume, but it erases the path the price took between frames. For a slow strategy that is a fine trade. For anything reading short-term order flow it can be fatal, because the signal often lives precisely in the events that were merged away.
The cleanest way to feel this is to compare a coarse snapshot against the finer path underneath it. A one-minute bar is itself a conflated snapshot of a whole minute of ticks, and its close is a single number standing in for everything that happened in those sixty seconds.
# A conflated snapshot (1m closes) draws far less travel than the intra-bar path.
import os
from pathlib import Path

import matplotlib

matplotlib.use("Agg")
import matplotlib.pyplot as plt
import seaborn as sns
from openalgo import api

client = api(
    api_key=os.getenv("OPENALGO_API_KEY", "your_api_key_here"),
    host=os.getenv("OPENALGO_HOST", "http://127.0.0.1:5000"),
)

SYMBOL, EXCHANGE = "RELIANCE", "NSE"
df = client.history(symbol=SYMBOL, exchange=EXCHANGE, interval="1m",
                    start_date="2026-06-20", end_date="2026-06-27")

# Use the most recent trading day, first 60 minutes (the liveliest stretch).
last = sorted(set(df.index.date))[-1]
day = df[df.index.date == last].head(60)

# Conflated snapshot: one print per minute, the close. This is all a snapshot feed
# would deliver. Dense proxy: walk open -> high -> low -> close inside each bar,
# a stand-in for the ticks the snapshot threw away.
snap_x, snap_y = [], []
dense_x, dense_y = [], []
for i, (_, bar) in enumerate(day.iterrows()):
    dense_x += [i, i + 0.25, i + 0.5, i + 0.75]
    dense_y += [bar.open, bar.high, bar.low, bar.close]
    snap_x.append(i + 0.75)
    snap_y.append(bar.close)

snap_len = sum(abs(snap_y[j] - snap_y[j - 1]) for j in range(1, len(snap_y)))
dense_len = sum(abs(dense_y[j] - dense_y[j - 1]) for j in range(1, len(dense_y)))

sns.set_theme(style="whitegrid")
fig, ax = plt.subplots(figsize=(9, 4.5))
ax.plot(dense_x, dense_y, color="#9a9a9a", lw=1.0, alpha=0.9,
        label=f"intra-bar proxy (O-H-L-C), travel {dense_len:.0f} pts")
ax.plot(snap_x, snap_y, color="#7c83ff", lw=1.8, marker="o", ms=4,
        label=f"conflated snapshot (1m close), travel {snap_len:.0f} pts")
ax.set_title(f"{SYMBOL} {last} - a snapshot hides the intra-bar path")
ax.set_xlabel("minute of session")
ax.set_ylabel("price")
ax.legend(loc="best", framealpha=0.9)

out = Path(__file__).with_suffix(".png")
plt.savefig(out, dpi=110, bbox_inches="tight")
print(f"{SYMBOL} {last}, 60x 1m bars: close-only snapshot travelled {snap_len:.1f} pts; "
f"intra-bar proxy travelled {dense_len:.1f} pts ({dense_len/snap_len:.1f}x). Saved {out.name}")RELIANCE 2026-06-25, 60x 1m bars: close-only snapshot travelled 37.9 pts; intra-bar proxy travelled 151.6 pts (4.0x). Saved 02_conflation_hides_detail.png
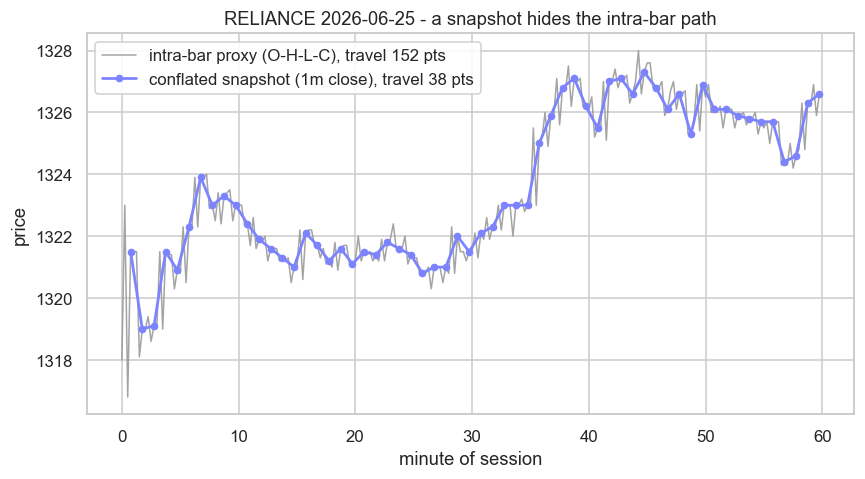
Over the first 60 one-minute bars of RELIANCE on 2026-06-25, the close-only snapshot traced a path of just 37.9 points of total travel. The intra-bar proxy - walking open to high to low to close inside each bar - travelled 151.6 points, almost exactly 4 times as far. The price genuinely moved four times as much as the snapshot recorded; the rest was conflated into the closing print. A market maker or a short-horizon signal lives in that missing 75 percent.
Backtests built on conflated bars systematically understate intraday range, slippage and the number of times a stop or limit would have been touched. A level your one-minute close never reached may have been hit hard intra-bar. Never assume the snapshot saw what the market did.
Feed handlers, sequence numbers and gaps
The component that ingests a feed and maintains your local book is the feed handler. On a tick feed its job is exact bookkeeping: apply each add, modify, cancel and trade in order so your copy matches the exchange byte for byte. To make that possible the exchange stamps every message with a monotonically increasing sequence number. The handler's contract is simple and unforgiving: if the next message is not the sequence you expected, you have a gap, and your book is now potentially wrong.
Gaps happen because real networks drop and reorder packets, especially on the UDP multicast that exchanges broadcast over. A robust handler detects the break, stops trusting its book, and recovers - typically by requesting a fresh full snapshot to re-anchor, then replaying incremental ticks on top once the sequence lines up again. This snapshot-plus-incremental design is why both feed types coexist: the tick stream gives you precision, and a periodic snapshot gives you a recovery point. We rebuild a book from such an event stream from scratch in the next chapter (ch33).
A snapshot feed has no gaps to chase - each frame is self-contained, so a dropped packet just means you wait for the next photo. That simplicity is a real operational advantage and part of why snapshot APIs dominate retail. You trade completeness for robustness.
Choosing a feed
There is no universally best feed, only the right one for your holding period and budget. Match the feed to what the strategy actually needs.
| Strategy horizon | Feed that suffices | Why |
|---|---|---|
| Position / swing (days) | L1 snapshot | You act on closes; depth and ticks add noise, not edge |
| Intraday systematic (minutes) | L2 snapshot or conflated depth | You size against the ladder and watch imbalance |
| Market making / short-horizon | Full-depth tick feed | The edge is in the events conflation would erase |
| HFT / queue racing | L3 tick-by-tick, colocated | Queue position and microsecond latency decide P&L |
The trap is paying for a feed you cannot use. A full L3 tick-by-tick stream is enormous, demands a colocated handler that never falls behind, and is wasted on a strategy that trades twice a day. Equally, running a passive market-making book off a 200-millisecond snapshot is a quiet way to get adversely selected on every quote. Be honest about your horizon, then buy exactly the resolution it requires and not a level more.
In short: snapshots tell you the state, tick feeds tell you the story, and the depth tier (L1, L2, L3) sets how far behind the touch you can see. With the feed understood, the natural next step is to take a raw stream of book events and rebuild the order book from it - deterministically, gap-aware, and replayable - which is exactly where ch33 takes us.