India VIX and the Volatility Risk Premium
The market's fear gauge and the premium for selling insurance - how India VIX is built, what it predicts, and the volatility risk premium.
- ·How India VIX is computed
- ·VIX as expected move
- ·Implied vs realized gap
- ·The volatility risk premium
- ·VIX and the index
- ·Trading the premium
Every options trader quotes a volatility, but the market quotes a thousand of them - one per strike, one per expiry, the whole surface of Chapter 53. India VIX takes that entire mess and crushes it into a single number that the financial press calls the fear gauge. Behind the headline sits one of the most elegant ideas in derivatives: you can read the market's expected volatility without trusting any pricing model at all. And once you can measure expected volatility, you can compare it to what actually happens - and discover that the market almost always overpays for fear. That persistent overpayment is the volatility risk premium, and harvesting it is one of the most crowded trades in the Indian market.
How India VIX is built: model-free from the chain
Recall from Chapter 52 that a single Black-76 implied vol is model-dependent - feed in a price, invert the formula, out comes one number that is only as good as the model's assumptions. India VIX deliberately throws that approach away. It is model-free: instead of inverting one option, it sums the entire out-of-the-money NIFTY option chain into a quantity that mathematically equals the price of a 30-day variance swap, the fair value of future variance itself.
The machinery, which NSE adopted from the global VIX methodology, looks intimidating but says something simple. Take every OTM call and put across the near and next weekly expiries. Weight each option's price by ΔK / K² - wider strike gaps and lower strikes count for more - sum them up, scale by 2/T, subtract a small forward-correction term, and you have the expected 30-day variance. Take the square root, annualise, multiply by 100, and that is India VIX in percentage points.
The 1/K² weighting is the heart of it. A variance swap's payoff is replicated by holding a strip of options across all strikes, with that exact weighting. India VIX is not an opinion about volatility - it is the no-arbitrage cost of the portfolio that pays off the realized variance of NIFTY. That is why it needs no model.
The practical consequences matter for a quant. Because VIX integrates the whole chain, the fat OTM-put premium you saw in the skew (Chapter 53) pushes VIX up: crash insurance is part of the sum. Because it uses the near and next expiry interpolated to a constant 30 days, it is always a clean 30-day forward look. And because it is a single liquid-chain construction, it updates every few seconds through the trading day.
VIX as the expected move
A VIX of 13 is not a price and not a direction - it is an annualised one-standard-deviation move. To make it usable, scale it to your horizon by the square-root-of-time rule: divide by sqrt(252) for a one-day move, by sqrt(12) for a 30-day move. Multiply by the NIFTY level and you get an expected move in index points.
# India VIX is implied vol; NIFTY's own moves are realized vol. The gap is the premium.
import os

import numpy as np
from openalgo import api

client = api(
    api_key=os.getenv("OPENALGO_API_KEY", "your_api_key_here"),
    host=os.getenv("OPENALGO_HOST", "http://127.0.0.1:5000"),
)

# 1. India VIX = the market's 30-day implied (forward) volatility, in annualised %.
vix = client.quotes(symbol="INDIAVIX", exchange="NSE_INDEX")["data"]["ltp"]

# 2. NIFTY daily history -> realized (backward-looking) volatility from log returns.
nifty = client.history(symbol="NIFTY", exchange="NSE_INDEX", interval="D",
                       start_date="2025-04-01", end_date="2026-06-28")
spot = nifty["close"].iloc[-1]
ret = np.log(nifty["close"] / nifty["close"].shift(1)).dropna()
realized = ret.tail(21).std(ddof=1) * np.sqrt(252) * 100   # trailing ~1 month, annualised

# 3. VIX as an expected move: annual vol scaled to the horizon, then to NIFTY points.
move_1d = spot * (vix / 100) / np.sqrt(252)
move_30d = spot * (vix / 100) / np.sqrt(12)

# 4. The volatility risk premium = implied minus realized (today, and over the year).
vix_hist = client.history(symbol="INDIAVIX", exchange="NSE_INDEX", interval="D",
                          start_date="2025-04-01", end_date="2026-06-28")["close"]
rv_series = ret.rolling(21).std(ddof=1) * np.sqrt(252) * 100
vrp = (vix_hist - rv_series).dropna().loc["2025-06-25":]

print(f"India VIX (implied, 30-day annualised): {vix:.2f}%")
print(f"NIFTY realized vol (trailing 21 sessions):  {realized:.2f}%")
print(f"Volatility risk premium today: {vix - realized:+.2f} vol points\n")
print(f"VIX expects a 1-sigma NIFTY move of {move_1d:,.0f} pts/day, {move_30d:,.0f} pts over 30 days "
      f"(spot {spot:,.0f}).\n")
print(f"Over the last year: mean implied {vix_hist.loc[vrp.index].mean():.2f}%, "
      f"mean realized {rv_series.loc[vrp.index].mean():.2f}%, mean premium {vrp.mean():+.2f} pts; "
f"implied beat realized on {(vrp > 0).mean() * 100:.0f}% of days.")India VIX (implied, 30-day annualised): 13.05% NIFTY realized vol (trailing 21 sessions): 12.59% Volatility risk premium today: +0.46 vol points VIX expects a 1-sigma NIFTY move of 198 pts/day, 906 pts over 30 days (spot 24,056). Over the last year: mean implied 13.77%, mean realized 11.84%, mean premium +1.93 pts; implied beat realized on 82% of days.
With India VIX at 13.05% and NIFTY at 24,056, the gauge expects a one-sigma move of about 198 points in a single day and roughly 906 points over the next 30 days. That is the market's own confidence interval. If you are sizing a short straddle, pricing a stop, or stress-testing an overnight position, this is the number that tells you what "normal" looks like right now. When VIX doubles, your expected move doubles, and a stop that was comfortable yesterday is inside the noise today.
Turn VIX into a daily budget. At VIX 13, a one-sigma NIFTY day is about 0.8%. If your intraday strategy targets moves smaller than that, you are trading inside the noise and microstructure costs (Module C) will dominate. Let the fear gauge set the scale of what is worth trading.
The implied-versus-realized gap
India VIX is implied volatility - a forward-looking forecast baked into option prices. Set it beside realized volatility - the actual annualised standard deviation of NIFTY's recent daily returns - and a gap appears. The example computes realized vol over the trailing 21 sessions at 12.59% against implied 13.05%, a premium today of just +0.46 vol points. Thin, on this particular calm afternoon. But widen the lens to a full year and the structure emerges: mean implied 13.77%, mean realized 11.84%, an average premium of +1.93 vol points, with implied beating realized on 82% of days.
That is not noise. It is the volatility risk premium (VRP): the systematic tendency of option-implied volatility to sit above the volatility that subsequently shows up. Options are, on average, expensive. The buyer of a NIFTY straddle is buying insurance, and like all insurance it is priced to lose a little on average so the seller is paid to carry the risk.
Why the premium exists, and why VIX moves inverse to price
Why would anyone systematically overpay? Because volatility shows up exactly when it hurts most. Volatility spikes are violently correlated with market crashes, so a long-volatility position is a hedge against the worst days - and investors pay up for hedges, just as they pay up for the OTM puts that fatten the skew. The seller, in return, demands compensation for occasionally getting run over. The premium is the price of that risk transfer.
This same crash-correlation is why the gauge is called a fear gauge at all. India VIX rises as NIFTY falls and falls as NIFTY rises, a strong negative relationship you can measure directly.
# India VIX spikes up exactly when NIFTY falls - plot the inverse fear gauge over a year.
import os
from pathlib import Path

import matplotlib

matplotlib.use("Agg")
import matplotlib.pyplot as plt
import numpy as np
import seaborn as sns
from openalgo import api

client = api(
    api_key=os.getenv("OPENALGO_API_KEY", "your_api_key_here"),
    host=os.getenv("OPENALGO_HOST", "http://127.0.0.1:5000"),
)

nifty = client.history(symbol="NIFTY", exchange="NSE_INDEX", interval="D",
                       start_date="2025-06-28", end_date="2026-06-28")
vix = client.history(symbol="INDIAVIX", exchange="NSE_INDEX", interval="D",
                     start_date="2025-06-28", end_date="2026-06-28")

# Inverse relationship: NIFTY daily return vs same-day change in India VIX.
ret = np.log(nifty["close"] / nifty["close"].shift(1)).dropna()
corr = np.corrcoef(ret, vix["close"].diff().loc[ret.index])[0, 1]
fear_days = vix["close"].nlargest(3).index   # the year's biggest fear spikes

sns.set_theme(style="whitegrid")
fig, ax1 = plt.subplots(figsize=(9, 4.5))
ax1.plot(nifty.index, nifty["close"], color="#7c83ff", lw=1.6, label="NIFTY")
ax1.set_ylabel("NIFTY", color="#7c83ff")
ax2 = ax1.twinx()
ax2.plot(vix.index, vix["close"], color="#dc2626", lw=1.4, label="India VIX")
ax2.set_ylabel("India VIX (%)", color="#dc2626")
ax2.grid(False)
for d in fear_days:
    ax1.axvline(d, color="#dc2626", ls=":", lw=1.1, alpha=0.7)
ax1.set_title(f"India VIX spikes as NIFTY drops (return-vs-VIX-change corr {corr:+.2f})")

out = Path(__file__).with_suffix(".png")
plt.savefig(out, dpi=110, bbox_inches="tight")
peak = vix["close"].max()
print(f"NIFTY-return vs VIX-change correlation {corr:+.2f}; VIX peaked at {peak:.2f}% "
f"on {vix['close'].idxmax().date()}. Saved {out.name}")NIFTY-return vs VIX-change correlation -0.75; VIX peaked at 27.89% on 2026-03-30. Saved 02_vix_vs_nifty.png
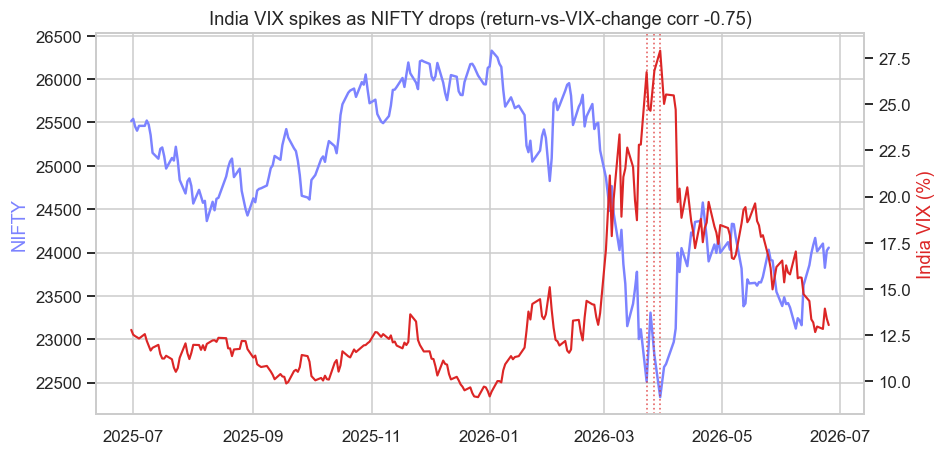
Over the past year the correlation between NIFTY's daily return and the same-day change in India VIX comes out at -0.75 - tight and reliably negative. The chart shows it cleanly: through the calm second half of 2025 VIX drifts in the low teens, then in late March 2026 NIFTY drops and VIX rockets to a peak of 27.89% on 30 March 2026 before subsiding. Fear and falling prices arrive together. This is also why selling volatility is short crash risk in disguise: you collect the small premium on calm days and surrender it, sometimes all at once, when the gauge spikes.
The volatility risk premium is real but it is not free money. Short-volatility books earn a steady trickle and then lose a flood. The premium is compensation for tail risk, and a single February-2018-style or March-2020-style spike can erase years of carry. A 0.46-point edge today says nothing about the size of the next gap-up in VIX. Size for the spike, not for the average.
Trading the premium
A quant has three broad ways to engage with this premium. The first is to sell it directly: short ATM straddles or strangles on NIFTY, delta-hedged, so that you are long realized-versus-implied - you profit when realized vol comes in below the implied you sold. This is the purest VRP harvest and the most dangerous; it demands disciplined delta hedging (Chapter 52), hard position limits, and an honest accounting of tail risk and margin (Chapter 58).
The second is to use VIX as a regime signal. Because it leads nothing but summarises everything, VIX is a superb conditioning variable: scale position size down when VIX is high and rising, demand wider stops, switch a mean-reversion book off when the gauge says the regime has turned. A signal that works at VIX 11 often dies at VIX 27.
The third is to trade the term structure of volatility itself - the difference between this week's implied and next month's, which steepens and inverts around events and expiry. India's weekly-expiry dominance makes this especially rich, and it ties directly to the expiry-day dynamics of the next chapter.
India VIX is the model-free, 30-day expected volatility of NIFTY, distilled from the whole option chain. It usually sits above the volatility that follows - the volatility risk premium - because the market overpays for crash insurance. You can harvest that premium by selling options, but you are being paid precisely for the risk of the rare, violent spike when VIX and the market move hard in opposite directions.
We can now read what the market expects, what it actually delivers, and the premium between the two. The last piece of the volatility puzzle is the wild near-expiry behaviour unique to India's weekly options - exploding gamma, collapsing theta, and the expiry-day games where this premium is won and lost.