The Volatility Surface & India VIX
Implied volatility, the skew and smile, the term structure, and reading India VIX as the market's fear gauge.
- ·Implied volatility
- ·The volatility smile & skew
- ·Term structure
- ·India VIX explained
- ·Weekly-expiry dynamics
- ·Reading the surface
Black-76 made a clean assumption: one volatility for the option. But point it at a real Nifty option chain and the assumption shatters - the market quotes a different implied volatility at every single strike. That pattern of IVs across strikes and expiries is the volatility surface, and far from being a flaw to ignore, it's where the most sophisticated options trading lives. Reading the surface is reading the market's deepest fears and expectations. Let's learn to see it.
The smile that breaks the model
If the model were right, every strike of the same expiry would imply the same volatility. They don't. Pull the implied vol across a row of Nifty strikes and watch:
# Implied volatility isn't flat across strikes - it skews. India VIX sums it all up.
import os
import time

from openalgo import api

client = api(
    api_key=os.getenv("OPENALGO_API_KEY", "your_api_key_here"),
    host=os.getenv("OPENALGO_HOST", "http://127.0.0.1:5000"),
)

vix = client.quotes(symbol="INDIAVIX", exchange="NSE_INDEX")["data"]["ltp"]
print(f"India VIX (the market's 30-day implied volatility): {vix}%\n")

print(f"{'STRIKE':>8s}{'IV %':>9s}")
for strike in range(23400, 24701, 100):
    r = client.optiongreeks(symbol=f"NIFTY30JUN26{strike}CE", exchange="NFO", interest_rate=0.0,
                            underlying_symbol="NIFTY", underlying_exchange="NSE_INDEX")
    iv = r.get("implied_volatility")
    if iv:
        print(f"{strike:>8d}{iv:>9.2f}")
    time.sleep(0.3)

print("\nLower strikes carry HIGHER implied vol - the 'skew' - because crash insurance (puts) is dear.")India VIX (the market's 30-day implied volatility): 13.39% STRIKE IV % 23400 14.59 23500 13.23 23600 12.33 23700 12.10 23800 11.59 23900 11.40 24000 11.15 24100 11.04 24200 10.83 24300 10.72 24400 10.76 24500 11.04 24600 11.31 24700 11.77 Lower strikes carry HIGHER implied vol - the 'skew' - because crash insurance (puts) is dear.
The IVs aren't flat at all - they slope from over 14% at low strikes down to under 11% near the money, then curl back up for far out-of-the-money calls. That shape - high on the wings, low in the middle - is the famous volatility smile, and its lopsided, put-heavy version is the skew. The constant-volatility assumption was a convenient fiction; the market quietly corrects it by charging a different vol at every strike.
Reading the skew
Plot it and the curve speaks:
# Plot the volatility skew - implied vol against strike - with India VIX for scale.
import os
import time
from pathlib import Path

import matplotlib

matplotlib.use("Agg")
import matplotlib.pyplot as plt
import pandas as pd
import seaborn as sns
from openalgo import api

client = api(
    api_key=os.getenv("OPENALGO_API_KEY", "your_api_key_here"),
    host=os.getenv("OPENALGO_HOST", "http://127.0.0.1:5000"),
)

vix = client.quotes(symbol="INDIAVIX", exchange="NSE_INDEX")["data"]["ltp"]
rows = []
for strike in range(23400, 24701, 100):
    r = client.optiongreeks(symbol=f"NIFTY30JUN26{strike}CE", exchange="NFO", interest_rate=0.0,
                            underlying_symbol="NIFTY", underlying_exchange="NSE_INDEX")
    if r.get("implied_volatility"):
        rows.append({"strike": strike, "iv": r["implied_volatility"]})
    time.sleep(0.3)

df = pd.DataFrame(rows)
sns.set_theme(style="whitegrid")
fig, ax = plt.subplots(figsize=(8, 4.5))
ax.plot(df["strike"], df["iv"], color="#7c83ff", lw=2, marker="o", ms=4, label="implied vol")
ax.axvline(24058, color="#888", ls="--", lw=1.2, label="forward ~24058")
ax.axhline(vix, color="#16a34a", ls=":", lw=1.6, label=f"India VIX {vix}%")
ax.set_title("NIFTY implied-volatility skew (lower strikes = pricier insurance)")
ax.set_xlabel("Strike")
ax.set_ylabel("Implied volatility (%)")
ax.legend()

out = Path(__file__).with_suffix(".png")
plt.savefig(out, dpi=110, bbox_inches="tight")
print(f"IV runs {df['iv'].max():.1f}% (low strikes) -> {df['iv'].min():.1f}% (high strikes). India VIX {vix}%. Saved {out.name}")IV runs 14.6% (low strikes) -> 10.7% (high strikes). India VIX 13.39%. Saved 02_vol_smile.png
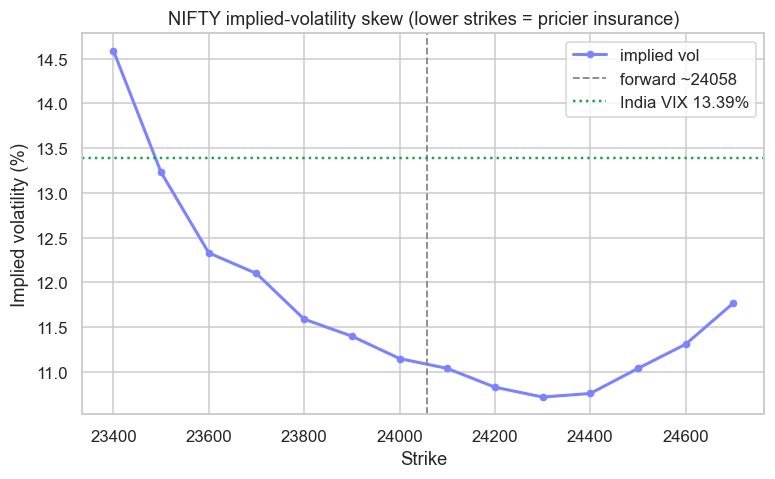
The left side - low strikes, the out-of-the-money puts - carries the highest implied vol. That's no accident: those puts are crash insurance, and investors pay a fat premium for downside protection, bidding their IV up. The right side, OTM calls, curls up more gently. The dip in the middle is the at-the-money strike, the "cheapest" volatility. The whole shape is the market pricing in the fat tails of Chapter 11 - the model assumes a thin-tailed bell curve, so traders compensate by charging extra vol exactly where the dangerous tail events live.
The term structure and the full surface
Strikes are only one axis. Implied vol also varies by expiry - near-dated options often price a different vol than far-dated ones, the term structure of volatility. Stack the skew across every expiry and you get the full volatility surface: a 3-D landscape of IV over strike and time. Professional options desks trade the shape of this surface - betting that the skew will steepen, that near-term vol will spike, that the term structure will flip - far more than they bet on direction.
India VIX: the fear gauge
All of this distils into one famous number. India VIX takes the whole Nifty option chain and computes the market's expected volatility over the next 30 days - a single read on collective fear:
The example shows it at 13.39%. When markets are calm it sits low (10-13%); when fear grips - a crash, an election shock - it spikes toward 25, 30, even higher. Recall Chapter 2: VIX moves inverse to the market, rising as prices fall, because fear and falling prices arrive together. A quant watches India VIX as a regime signal, a sizing input, and - because it's tradeable through futures - an asset in its own right.
Implied volatility is the market's forecast of future volatility, strike by strike and expiry by expiry. The skew is the price of crash insurance; India VIX is the whole surface boiled down to one fear gauge. Options traders trade this - the shape and level of implied vol - not the direction of the underlying.
Weekly-expiry dynamics
India deserves a special note here. Indian index options are dominated by weekly expiries, and a near-expiry option is a wild animal: with only days of life, its gamma and theta explode, its IV gyrates, and on expiry day itself the price can swing violently around the strike as it decays to its final value. Much of India's enormous options volume - and many of its quant strategies (Module G) - revolve around this weekly heartbeat. The skew you see on a 6-day option behaves very differently from one with months to run.
Try it yourself
- Build the skew from puts instead of calls. Does the put side show even higher IV, confirming the crash-fear premium?
- Pull the ATM IV for this week's expiry and next month's. Is the near-term or far-term vol higher right now (the term structure)?
- Track India VIX across a volatile week. How high does it spike, and does it fall back as the market stabilises?
Recap
- Real option chains quote a different implied volatility at every strike - the volatility smile, and its put-heavy form, the skew.
- The skew is highest for OTM puts because crash insurance is expensive - the market pricing in fat tails the model ignores.
- IV also varies by expiry (the term structure); together, strike × expiry forms the full volatility surface that desks trade.
- India VIX distils the Nifty chain into the market's 30-day expected volatility - a fear gauge that moves inverse to price and is tradeable itself.
- India's weekly expiries make near-dated options especially wild - exploding gamma and theta, gyrating IV, and violent expiry-day moves.
We can now read what volatility is worth. The final step is to trade it - to treat volatility itself as an asset, harvest the premium the market pays for fear, and understand the expiry-day games unique to Indian options.