The Alpha Research Process
Turning a hunch into a tested edge - hypothesis, data, test, validation: the scientific method for trading.
- ·Idea to hypothesis
- ·Designing a fair test
- ·Signal vs noise
- ·In-sample vs out-of-sample
- ·Decay & capacity
- ·A research checklist
Everything so far - microstructure, maths, models, portfolios - was preparation. Module G is the payoff: actually finding an edge and proving it's real. And the surprising truth is that finding a beautiful backtest is easy; anyone can do it in an afternoon. The hard, valuable, professional skill is the research process - the disciplined method that separates a genuine edge from the thousand mirages randomness throws up (Chapter 13). This chapter is that process. Master it and the strategy chapters that follow become safe to attempt; skip it and they're just elaborate ways to lose money.
From idea to hypothesis
It starts with an idea - "momentum works," "volatility mean-reverts," "stocks drift after earnings." But a vague idea can't be tested or be wrong. The first discipline is turning it into a precise, falsifiable hypothesis: not "momentum works" but "NSE stocks in the top quintile of 12-month return outperform the bottom quintile over the next month, after costs." Now it's a claim with a number, a universe, and a horizon - something reality can confirm or kill.
Designing a fair test
Next, build a test that can't fool you. That means no look-ahead (never use information you wouldn't have had in real time), no survivorship bias (include the stocks that later delisted), realistic costs (Chapter 4), and one honest definition of success fixed before you look. A test rigged - even unconsciously - to flatter your idea will always flatter it.
In-sample versus out-of-sample
Now the single most important technique in all of quant research. Split your data. Search, optimise and iterate all you like on the first portion - the in-sample set. Then test your finished idea, exactly once, on data it has never touched - the out-of-sample set:
Let's do exactly that. We'll search dozens of moving-average lengths on the first half of Nifty's history, keep the best, and then test that winner - untouched - on the second half:
# In-sample vs out-of-sample: the test that separates a real edge from an overfit one.
import os
from datetime import datetime

import numpy as np
from openalgo import api

client = api(
    api_key=os.getenv("OPENALGO_API_KEY", "your_api_key_here"),
    host=os.getenv("OPENALGO_HOST", "http://127.0.0.1:5000"),
)

end = datetime.now().strftime("%Y-%m-%d")
c = client.history(symbol="NIFTY", exchange="NSE_INDEX", interval="D",
                   start_date="2019-01-01", end_date=end)["close"]
r = c.pct_change()
split = len(c) // 2


def sharpe(x):
    return x.mean() / x.std() * np.sqrt(252) if x.std() else 0


# Search MANY moving-average lengths on the IN-SAMPLE half, keep the best.
best_n, best_s = None, -99
for n in range(10, 121, 5):
    sig = (c > c.rolling(n).mean()).astype(int).shift(1)
    s = sharpe((sig * r).iloc[:split].dropna())
    if s > best_s:
        best_n, best_s = n, s

# Now test THAT winner, untouched, on the OUT-OF-SAMPLE half.
sig = (c > c.rolling(best_n).mean()).astype(int).shift(1)
oos = sharpe((sig * r).iloc[split:].dropna())

print(f"Best in-sample SMA length : {best_n} days  ->  Sharpe {best_s:.2f}  (looks great!)")
print(f"Same rule, out-of-sample  : Sharpe {oos:.2f}  (the honest verdict)")
print("\nThe edge that shone in-sample mostly evaporates out-of-sample - the signature of overfitting.")Best in-sample SMA length : 35 days -> Sharpe 1.23 (looks great!) Same rule, out-of-sample : Sharpe 0.57 (the honest verdict) The edge that shone in-sample mostly evaporates out-of-sample - the signature of overfitting.
There's the lesson in two numbers. The best rule looked brilliant in-sample (Sharpe 1.23) - because we searched for the one that did. Out-of-sample, the same rule managed only 0.57 - less than half. Some edge survived (trend-following isn't pure noise), but most of that gorgeous in-sample performance was the optimisation fitting the past, not discovering the future. The out-of-sample number is the only one you're allowed to believe.
The equity curve tells the truth
Plot the whole journey and the story is visual:
# The equity curve of an optimised rule - great in-sample, then reality bites.
import os
from datetime import datetime
from pathlib import Path

import matplotlib

matplotlib.use("Agg")
import matplotlib.pyplot as plt
import numpy as np
import seaborn as sns
from openalgo import api

client = api(
    api_key=os.getenv("OPENALGO_API_KEY", "your_api_key_here"),
    host=os.getenv("OPENALGO_HOST", "http://127.0.0.1:5000"),
)

end = datetime.now().strftime("%Y-%m-%d")
c = client.history(symbol="NIFTY", exchange="NSE_INDEX", interval="D",
                   start_date="2019-01-01", end_date=end)["close"]
r = c.pct_change()
split = len(c) // 2


def sharpe(x):
    return x.mean() / x.std() * np.sqrt(252) if x.std() else 0


best_n, best_s = 20, -99
for n in range(10, 121, 5):
    sig = (c > c.rolling(n).mean()).astype(int).shift(1)
    s = sharpe((sig * r).iloc[:split].dropna())
    if s > best_s:
        best_n, best_s = n, s

sig = (c > c.rolling(best_n).mean()).astype(int).shift(1)
equity = (1 + (sig * r).fillna(0)).cumprod()

sns.set_theme(style="whitegrid")
fig, ax = plt.subplots(figsize=(8, 4.5))
ax.plot(equity.index[:split], equity.iloc[:split], color="#16a34a", lw=1.6, label="in-sample (optimised here)")
ax.plot(equity.index[split:], equity.iloc[split:], color="#dc2626", lw=1.6, label="out-of-sample (the real test)")
ax.axvline(equity.index[split], color="#888", ls="--", lw=1)
ax.set_title(f"SMA({best_n}) strategy - optimised on green, tested on red")
ax.set_ylabel("Growth of 1")
ax.legend()

out = Path(__file__).with_suffix(".png")
plt.savefig(out, dpi=110, bbox_inches="tight")
print(f"Best SMA {best_n}. In-sample Sharpe {best_s:.2f}. Out-of-sample is the curve that counts. Saved {out.name}")Best SMA 35. In-sample Sharpe 1.23. Out-of-sample is the curve that counts. Saved 02_equity_split.png
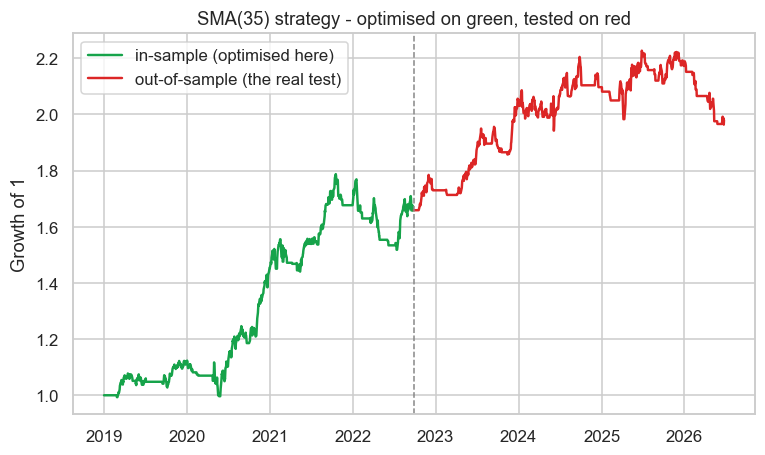
The green in-sample stretch climbs convincingly - that's the part we optimised. The red out-of-sample stretch is the real verdict: weaker, choppier, honest. Whenever you see a backtest, the question to ask is always "which part is in-sample, and what did it do after?" If the author can't show you a clean out-of-sample, assume the curve is fitted.
Signal versus noise, and the economic reason
Out-of-sample testing catches most overfitting, but the deepest filter is conceptual: demand an economic reason. A real edge exists because someone is paying it - for bearing a risk, for providing liquidity, for exploiting a structural quirk or a behavioural bias. If you can't name who's on the other side and why they'd keep losing, you've probably found a coincidence, however clean the out-of-sample looks. "It works but I don't know why" is a warning, not a strategy.
Decay and capacity
Finally, two truths about real edges. They decay: once an edge is known and crowded, it weakens or dies, so today's alpha is tomorrow's commodity. And they have capacity: every edge can only absorb so much capital before market impact (Chapter 7) eats it - a tiny inefficiency in an illiquid stock might be real and untradeable at size. A mature research process asks not just "is it real?" but "how long will it last, and how much can it hold?"
The research process is a sequence of filters designed to disprove your idea: a falsifiable hypothesis, a fair test, an honest out-of-sample, a named economic reason, and a clear view of decay and capacity. An edge that survives all of them might be real. The goal is never to confirm your idea - it's to try your hardest to kill it, and trade only what refuses to die.
A research checklist
Before trusting any edge, answer:
- Is the hypothesis precise and falsifiable?
- Is the test free of look-ahead, survivorship and unrealistic costs?
- Does it hold up out-of-sample, with the search honestly counted (Chapter 13)?
- Is there a clear economic reason someone pays this edge?
- What is its likely decay and capacity?
Try it yourself
- Optimise the strategy on the second half and test on the first (swap in- and out-of-sample). Does the "best" parameter change - and does the edge still survive?
- Add realistic costs to the out-of-sample test. How much of the surviving Sharpe is left after friction?
- Take any strategy idea you have and write its one-sentence falsifiable hypothesis and its economic reason. If you can't write the reason, be suspicious.
Recap
- Finding a great backtest is easy; the skill is the research process that proves an edge is real.
- Turn a vague idea into a precise, falsifiable hypothesis, then design a fair test (no look-ahead, survivorship or fantasy costs).
- Split the data: search on in-sample, test once on out-of-sample - our optimised rule fell from Sharpe 1.23 to 0.57, exposing the overfit.
- Demand a named economic reason an edge exists - "it works but I don't know why" is a warning, not a strategy.
- Real edges decay and have capacity limits - a mature process asks how long an edge lasts and how much it can hold.
With the process in hand, we can finally build strategies safely. First up is the purest market-neutral edge of all - statistical arbitrage, the disciplined, scaled-up form of the pairs trading we met in Chapter 17.