Equity Derivatives Microstructure in India
How index and single-stock F&O actually trade - liquidity across strikes and expiries, weekly vs monthly, and the microstructure quirks of Indian options.
- ·Index vs stock F&O liquidity
- ·Weekly vs monthly expiries
- ·Strike liquidity and spreads
- ·Expiry concentration
- ·Physical settlement of stock F&O
- ·Microstructure quirks
India runs one of the largest equity-derivatives markets on earth by contract count, yet almost all of that turnover huddles inside a startlingly small set of instruments. A handful of index expiries, a few hundred points of strikes around spot, and the round numbers ending in 00 carry the overwhelming bulk of the trade. Step one strike away, or one expiry out, and the book thins to a trickle. If you want to trade these instruments as a quant, you must learn this terrain the way a sailor learns where the deep water is - because the chart price you see is only tradeable where the liquidity actually sits.
Index options are an ocean, single stocks a pond
The first fact of Indian derivatives microstructure is the gulf between index and single-stock liquidity. NIFTY and BANKNIFTY options are among the most heavily traded contracts in the world; their order books are deep, their spreads are tight in liquid strikes, and you can move size near the touch. Single-stock futures and options (stock F&O) are a different animal. Even a heavyweight like RELIANCE or HDFCBANK has options that, away from the near-month at-the-money strike, quote wide and trade thin. A mid-cap in the F&O list may have a near-empty far-week book.
Why the gap? An index is a basket, so its options aggregate the hedging and speculation of the whole market into one instrument that no single player can corner. A single stock concentrates idiosyncratic risk, attracts fewer natural two-sided participants, and is subject to the market-wide position limit (MWPL) and the F&O ban that freezes fresh positions once open interest crosses 95% of that limit. The practical lesson: backtest a single-stock options strategy and you are almost certainly assuming fills you would never get.
A backtest that prices options at the mid or the last-traded price quietly assumes a liquid two-sided book. In single-stock F&O and in far strikes that book often does not exist. The strategy can look brilliant on paper and be untradeable in size.
Weekly versus monthly expiries
The second structural fact is the expiry ladder. Indian index options trade weekly expiries stacked in front of the monthly. A near-week option is a short-dated, high-gamma instrument whose value decays in days; the monthly carries more time and more open interest of the positional kind. Most of the speculative churn lives in the nearest weekly, while hedgers and carry traders populate the monthly. NSE settles its index and stock derivatives on Tuesday; the other main exchange settles on Thursday. As you move from the front week to deferred weeks to the next month, liquidity drops off a cliff - the far-week book is often a desert of stale quotes.
This matters for any strategy that needs to roll. The cost of moving a position from one expiry to the next - the roll - is paid in the spread of the less-liquid leg, and that spread widens precisely in the contracts you are forced to trade near expiry.
Strike liquidity: the book fattens at round numbers
Now zoom into a single expiry and ask: across all the strikes, where does the trade actually concentrate? Pull the live chain and the answer is unambiguous.
# Where Nifty option liquidity lives: open interest by strike around the money.
import os

from openalgo import api

client = api(
    api_key=os.getenv("OPENALGO_API_KEY", "your_api_key_here"),
    host=os.getenv("OPENALGO_HOST", "http://127.0.0.1:5000"),
)

# Pull the 28-Jul-2026 monthly chain: every strike carries real-time OI and a quoted book.
r = client.optionchain(underlying="NIFTY", exchange="NSE_INDEX",
                       expiry_date="28JUL26", strike_count=6)
atm = r["atm_strike"]
ltp = r["underlying_ltp"]
chain = r["chain"]

print(f"NIFTY 28-Jul-2026 chain   spot {ltp}   ATM strike {atm:.0f}\n")
print(f"{'strike':>7}{'CE OI':>10}{'PE OI':>10}{'total OI':>11}{'CE spread':>11}")

book_open = False
for row in chain:
    s = row["strike"]
    ce, pe = row["ce"] or {}, row["pe"] or {}
    ce_oi, pe_oi = ce.get("oi", 0), pe.get("oi", 0)
    bid, ask = ce.get("bid", 0), ce.get("ask", 0)
    if bid > 0 and ask > 0:
        book_open = True
        spr = f"{ask - bid:.2f}"
    else:
        spr = "book shut"
    tag = "  <- ATM" if s == atm else ("  round" if s % 500 == 0 else "")
    print(f"{s:>7.0f}{ce_oi:>10}{pe_oi:>10}{ce_oi + pe_oi:>11}{spr:>11}{tag}")

# Find the fattest strike in this window and the round/500-multiple total.
tot = [(row["strike"], (row["ce"] or {}).get("oi", 0) + (row["pe"] or {}).get("oi", 0))
       for row in chain]
top_strike, top_oi = max(tot, key=lambda x: x[1])
if not book_open:
    print("\n(Quoted bid/ask are flat off-hours, so OI is the liquidity read here.)")
print(f"\nLiquidity piles at round strikes: {top_strike:.0f} carries {top_oi:,} contracts of OI, "
f"far above the thin half-strikes between the hundreds.")NIFTY 28-Jul-2026 chain spot 24056 ATM strike 24050 strike CE OI PE OI total OI CE spread 23750 13065 28145 41210 book shut 23800 167310 596180 763490 book shut 23850 18070 35425 53495 book shut 23900 282750 539175 821925 book shut 23950 21450 35035 56485 book shut 24000 4392635 4310670 8703305 book shut round 24050 62140 159705 221845 book shut <- ATM 24100 902850 879710 1782560 book shut 24150 55380 46670 102050 book shut 24200 1312350 1208025 2520375 book shut 24250 231205 215150 446355 book shut 24300 698815 427375 1126190 book shut 24350 63830 63505 127335 book shut (Quoted bid/ask are flat off-hours, so OI is the liquidity read here.) Liquidity piles at round strikes: 24000 carries 8,703,305 contracts of OI, far above the thin half-strikes between the hundreds.
For the 28-Jul-2026 NIFTY chain with spot near 24,056, the strike at 24000 carries 8,703,305 contracts of open interest - call and put combined - while the at-the-money half-strike at 24050 holds just 221,845, and the half-strikes scattered between the hundreds (24150, 24350) hold barely a hundred thousand each. The book does not thin smoothly away from spot; it spikes at the round numbers and collapses in between.
The mechanism is part habit, part design. Round strikes are Schelling points - psychologically focal numbers that hedgers, option writers and structured-product desks all gravitate to, so liquidity begets liquidity. Strategies are built around 24000 or 25000, not 24050 or 24150. The result is a comb-shaped liquidity profile, and it tells you exactly which strikes you can trade cheaply and which will cost you a fat spread to enter and a fatter one to exit.
When you choose strikes for a spread, a straddle or a hedge, snap to the round 500-multiples or at least the hundreds. The fill quality and exit liquidity at 24000 dwarf what you will get at the half-strike next door, even though it is only 50 points away.
Expiry-day concentration and pin risk
That clustering becomes extreme as expiry approaches. Open interest funnels into the round strikes nearest spot, and on expiry day the underlying often gravitates toward a heavy strike - the pin. With thousands of contracts of gamma concentrated there, option writers hedging their books mechanically buy dips and sell rips around the strike, which can hold the index unnaturally close to a round number into the close. For a short-gamma position this is the dangerous hour: a small move in the index produces an outsized swing in your delta, and the very liquidity you relied on can evaporate just when you need to flatten.
Plot the whole window and the concentration is obvious at a glance.
# Bar-chart Nifty open interest across strikes - liquidity clusters at round strikes.
import os
from pathlib import Path

import matplotlib

matplotlib.use("Agg")
import matplotlib.pyplot as plt
import pandas as pd
import seaborn as sns
from openalgo import api

client = api(
    api_key=os.getenv("OPENALGO_API_KEY", "your_api_key_here"),
    host=os.getenv("OPENALGO_HOST", "http://127.0.0.1:5000"),
)

# Wide window around the money so the round-strike clustering is visible.
r = client.optionchain(underlying="NIFTY", exchange="NSE_INDEX",
                       expiry_date="28JUL26", strike_count=22)
atm = r["atm_strike"]
rows = [{"strike": row["strike"],
         "oi": (row["ce"] or {}).get("oi", 0) + (row["pe"] or {}).get("oi", 0)}
        for row in r["chain"]]
df = pd.DataFrame(rows).sort_values("strike")
# Colour the 500-multiple "round" strikes apart from the rest.
df["round"] = df["strike"] % 500 == 0
colors = ["#7c83ff" if rnd else "#cbd5e1" for rnd in df["round"]]

sns.set_theme(style="whitegrid")
fig, ax = plt.subplots(figsize=(9, 4.5))
ax.bar(df["strike"], df["oi"] / 1e6, width=38, color=colors)
ax.axvline(atm, color="#dc2626", ls="--", lw=1.2, label=f"ATM {atm:.0f}")
ax.set_title("NIFTY 28-Jul-2026 open interest by strike (CE+PE) - clustered at round strikes")
ax.set_xlabel("Strike")
ax.set_ylabel("Total open interest (millions)")
ax.legend()

out = Path(__file__).with_suffix(".png")
plt.savefig(out, dpi=110, bbox_inches="tight")

peak = df.loc[df["oi"].idxmax()]
round_share = df.loc[df["round"], "oi"].sum() / df["oi"].sum() * 100
print(f"Peak OI at strike {peak['strike']:.0f} = {peak['oi'] / 1e6:.2f}M contracts; "
f"the 500-multiple round strikes hold {round_share:.0f}% of all OI in the window. Saved {out.name}")Peak OI at strike 24000 = 8.70M contracts; the 500-multiple round strikes hold 62% of all OI in the window. Saved 02_oi_concentration.png
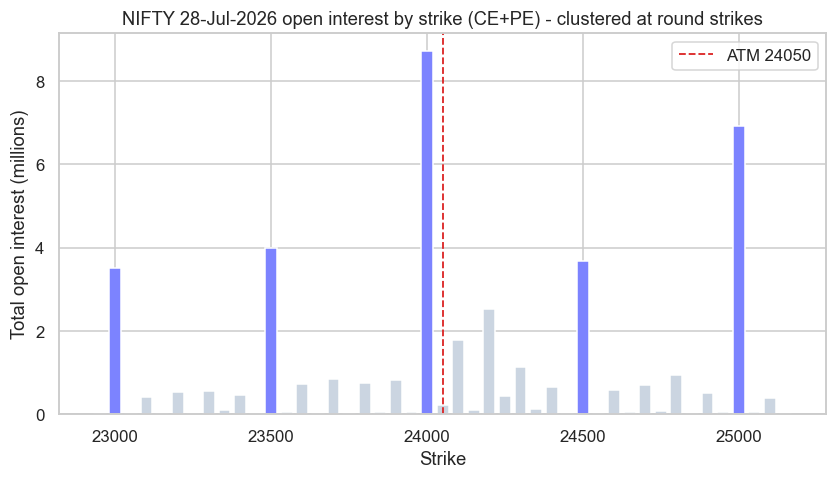
Across roughly forty-five strikes around the money, the five 500-multiple round strikes hold 62% of all the open interest in the window, with 24000 peaking at 8.70 million contracts and 25000 close behind near 6.93 million. The bar chart looks like a city skyline: a few towers at the round numbers, low-rise everywhere else. That picture is the single most important map of where you can and cannot transact.
Physical settlement and option microstructure quirks
A final trap separates stock F&O from index F&O: physical settlement. Index futures and options cash-settle to the settlement value. Stock derivatives, by contrast, settle by physical delivery - if you hold a single-stock futures position or an in-the-money stock option to expiry, you must give or take actual delivery of the shares, with the full cash value and the margin that implies. A 1-lot RELIANCE position that looks like a small derivatives bet becomes a 500-share delivery obligation worth several lakh rupees. Quants who let stock options drift to expiry without managing this have been handed brutal delivery margins and settlement surprises. The rule: know which contracts physically settle, and close or roll them well before the close on expiry day.
Index F&O cash-settles; single-stock F&O settles by physical delivery. An in-the-money stock option carried to expiry turns into a real obligation to deliver or receive shares at full notional. Always manage stock-derivative positions into expiry as if delivery is coming - because it is.
Beyond settlement, the option book carries its own quirks. Quotes obey a minimum tick size of 5 paise, so a 50-paise option lives on a coarse price grid where the spread is a large fraction of the premium. Deep out-of-the-money options can quote a one-tick-wide spread that is nonetheless 20% or more of their value. Books are quote-driven and lean on market makers, so they can thin or vanish in stress. And because Indian options are priced with Black-76 off the synthetic future (the forward), the relevant "spot" for every strike is the forward implied by the futures, not the cash index - a subtlety that matters the moment you start computing fair value or Greeks across the chain.
The live quoted book here reads flat because the examples were run with the market shut, so bid and ask come back as zero and open interest is the cleanest liquidity signal. During the session you would also see the spread tighten at the round strikes and gape at the thin ones - the same comb shape, now in basis points instead of contracts.
Why this is the ground truth of derivatives trading
Every options strategy in the rest of this course - the volatility trades of Chapter 54, the flow and expiry signals of Chapter 64 - lives or dies on the terrain mapped here. Liquidity concentrates at the index, in the front expiry, at the round strikes near the money, and it thins violently as you step away on any of those three axes. Combine that with physical settlement on the single-stock side and a coarse tick grid, and you have the real, frictional market that turns clean theory into tradeable or untradeable strategies. Read the strike ladder before you read the model. Next we leave equities for the currency and interest-rate corner of the derivatives world, where the microstructure rules change again.