Market Making and Inventory Risk
The other side of every trade - quoting both sides, earning the spread, and the inventory and adverse-selection risk that can wipe it out.
- ·Quoting both sides
- ·Earning the spread
- ·Inventory risk
- ·Adverse selection
- ·Avellaneda-Stoikov intuition
- ·Skewing quotes to manage inventory
A market maker is the trader who is always willing to deal. Post a bid and an ask on the same instrument, all day, and collect the difference from everyone who crosses to you. It sounds like a license to print money - you buy low, you sell high, you never chase. And in calm markets it almost is. The catch is the position you are left holding when the crowd suddenly all wants to sell to you at once. That leftover position, your inventory, is where market making lives or dies. This chapter is about earning the spread, the risk that quietly eats it, and the single most important trick for staying alive: skewing your quotes.
Quoting both sides for a living
A market maker quotes a two-sided market: a bid at which it will buy and an ask (or offer) at which it will sell, both around the current mid price (the average of best bid and best ask, your estimate of fair value). The distance from mid to each quote is your half-spread. If the mid is Rs 1,320 and you quote a bid at 1,319.80 and an ask at 1,320.20, your quoted spread is Rs 0.40 and you are hoping to buy at 1,319.80 and sell at 1,320.20, pocketing Rs 0.40 per share for doing nothing but standing in the middle.
You are paid this spread for providing liquidity - for being the counterparty who lets an impatient buyer or seller trade now instead of waiting. The buyer who lifts your ask pays you a small premium for immediacy; the seller who hits your bid does the same. Do this thousands of times a day across a liquid name and the spread adds up. This is the legitimate, useful service at the heart of every exchange, and it is exactly what the high-frequency makers of chapter 31 do in microseconds. You met the queue you join in chapter 20; now you are the one quoting.
A market maker does not predict direction. It earns the spread as compensation for supplying immediacy, and its central problem is not "where is the price going" but "what position am I accidentally accumulating while I quote".
The two P&Ls: spread versus inventory
Every market maker's profit and loss splits cleanly into two parts, and you must track them separately or you will fool yourself.
- Spread P&L is the edge you capture at the moment of each fill: you bought below mid or sold above mid. This is almost always positive, and it grows steadily with the number of fills. It is the income.
- Inventory P&L is the mark-to-market on whatever position you are left holding as the mid moves. If you keep buying and the price then falls, your growing long bleeds. This is the risk, and it is volatile.
The two always sum exactly to your total: total P&L equals spread captured plus inventory mark-to-market. The art of market making is keeping the first large and the second small. Our simulation on a real session makes the split concrete.
# Market-making P&L on a real RELIANCE session: spread captured vs inventory risk.
import os

import numpy as np
from openalgo import api

client = api(
    api_key=os.getenv("OPENALGO_API_KEY", "your_api_key_here"),
    host=os.getenv("OPENALGO_HOST", "http://127.0.0.1:5000"),
)

np.random.seed(7)  # the sim below is fully deterministic; seed kept for reproducibility

SYMBOL, DAY = "RELIANCE", "2026-06-25"
HALF, CLIP = 0.20, 100   # quote mid +/- Rs 0.20, trade 100 shares a clip
df = client.history(symbol=SYMBOL, exchange="NSE", interval="1m", start_date=DAY, end_date=DAY)
h, l, c = df["high"].values, df["low"].values, df["close"].values


def run(skew):
    """Quote both sides each minute; fill on the bar crossing our bid/ask. skew = Rs per clip of inventory."""
    cash, inv, buys, sells, rts, spread, fills, mid = 0.0, 0, 0, 0, 0, 0.0, [], c[0]
    for i in range(len(c)):
        bid = mid - HALF - skew * (inv / CLIP)        # lean quotes against inventory
        ask = mid + HALF - skew * (inv / CLIP)        # long -> both drop, so we sell more, buy less
        hit_bid, hit_ask = l[i] <= bid, h[i] >= ask
        if hit_bid:                                   # someone sold into our bid: we go longer
            cash -= bid * CLIP; inv += CLIP; buys += 1; spread += (mid - bid) * CLIP; fills.append((mid, +1))
        if hit_ask:                                   # someone lifted our ask: we go shorter
            cash += ask * CLIP; inv -= CLIP; sells += 1; spread += (ask - mid) * CLIP; fills.append((mid, -1))
        rts += hit_bid and hit_ask
        mid = c[i]
    last = c[-1]
    inv_pnl = sum((last - m) * CLIP if s > 0 else (m - last) * CLIP for m, s in fills)
    return dict(buys=buys, sells=sells, rts=rts, end=inv,
                spread=spread, inv_pnl=inv_pnl, net=cash + inv * last)


skewed, naive = run(0.01), run(0.0)
ret = 100 * (c[-1] / c[0] - 1)
print(f"{SYMBOL} NSE 1m  {DAY}  {len(c)} bars  open {c[0]:.2f}  close {c[-1]:.2f}  ({ret:+.2f}%)")
print(f"Quote mid +/- Rs {HALF:.2f}, clip {CLIP} shares\n")
for name, r in [("Inventory-skewed maker (skew Rs 0.01/clip)", skewed), ("Naive maker (no skew)", naive)]:
    print(f"{name}")
    print(f"  fills           : {r['buys'] + r['sells']}  ({r['buys']} buys, {r['sells']} sells, {r['rts']} round trips)")
    print(f"  spread captured : Rs {r['spread']:+,.0f}")
    print(f"  inventory m2m   : Rs {r['inv_pnl']:+,.0f}")
    print(f"  net P&L         : Rs {r['net']:+,.0f}   ending inventory {r['end']:+,} shares")
print(f"\nSpread income is similar (Rs {skewed['spread']:,.0f} vs {naive['spread']:,.0f}); "
      f"skewing cut the inventory loss from Rs {naive['inv_pnl']:,.0f} to Rs {skewed['inv_pnl']:,.0f} "
f"and net from Rs {naive['net']:,.0f} to Rs {skewed['net']:,.0f} on a {ret:+.2f}% day.")RELIANCE NSE 1m 2026-06-25 375 bars open 1321.50 close 1316.50 (-0.38%) Quote mid +/- Rs 0.20, clip 100 shares Inventory-skewed maker (skew Rs 0.01/clip) fills : 519 (262 buys, 257 sells, 152 round trips) spread captured : Rs +10,285 inventory m2m : Rs -14,110 net P&L : Rs -3,825 ending inventory +500 shares Naive maker (no skew) fills : 547 (302 buys, 245 sells, 175 round trips) spread captured : Rs +10,940 inventory m2m : Rs -42,680 net P&L : Rs -31,740 ending inventory +5,700 shares Spread income is similar (Rs 10,285 vs 10,940); skewing cut the inventory loss from Rs -42,680 to Rs -14,110 and net from Rs -31,740 to Rs -3,825 on a -0.38% day.
On RELIANCE for 2026-06-25, a session of 375 one-minute bars that drifted from 1321.50 down to 1316.50 (a quiet -0.38% day), a maker quoting mid plus or minus Rs 0.20 in 100-share clips got 519 fills and captured Rs +10,285 of spread. That is the good news. The bad news is the inventory: it marked at Rs -14,110, for a net of Rs -3,825. The income was real and steady; the inventory turned a clean spread business into a losing day.
Adverse selection: why the spread is not free
Why did inventory leak so much? Because of adverse selection - the uncomfortable truth that the person trading against your quote often knows something, or at least is pushing in a direction that is about to continue. When RELIANCE was sliding all afternoon, who was hitting your bid? Sellers. So you kept buying a falling market. Your inventory grew long precisely as the price you paid kept being too high. The fills that look like free spread are systematically the ones that hurt: you get filled on the side the market is leaving.
This is the market maker's central dilemma. The same flow that pays you the spread also loads you with the wrong position at the wrong time. A naive maker who quotes symmetrically and never adjusts will, on any trending day, accumulate a large directional bet it never wanted. The simulation shows it starkly: the naive maker (no inventory control) earned a similar Rs +10,940 of spread but ended the day +5,700 shares long into the decline, marking at Rs -42,680, for a net loss of Rs -31,740 - more than eight times worse than the controlled maker, on identical quotes. The spread income was nearly the same; the entire difference was inventory.
The spread is not free money. On a trending session a market maker is effectively short the trend - it is forced to buy as the market falls and sell as it rises. Without inventory control, a single bad afternoon can hand back weeks of patiently earned spread.
Skewing quotes: the Avellaneda-Stoikov idea
The fix is elegant and is the single most important idea in modern market making: do not quote around the mid, quote around a reservation price that leans away from your inventory. When you are long, shift both your bid and your ask down. Your ask becomes more aggressive, so you sell and shed the long faster; your bid becomes more passive, so you buy less and stop adding to it. When you are short, do the opposite and shift both quotes up. The market gently does your position-management for you.
This is the intuition behind the Avellaneda-Stoikov model, the standard academic framework for market making (Avellaneda and Stoikov, 2008). Their result is that the optimal quotes are centred not on the mid but on a reservation price r = mid - q x gamma x sigma squared x (time remaining), where q is your inventory, gamma is your risk aversion and sigma is volatility. The detail to carry away is the shape, not the formula: the more inventory you hold, the more volatile the asset, and the more risk-averse you are, the harder you lean your quotes against the position. As the close approaches and the term (time remaining) shrinks, the skew also fades because you have less time to be caught holding risk.
Implement the skew as a small price offset proportional to inventory: bid = mid - half_spread - k*q and ask = mid + half_spread - k*q. The single constant k (rupees of skew per unit of inventory) is your risk dial. Larger k holds inventory tighter at the cost of giving up some captured spread.
In the simulation that one line of skew, with k of just Rs 0.01 per 100-share clip, is the entire difference between the two makers. It cut the peak inventory from 5,900 shares down to 1,400, ended the day roughly flat at +500 shares instead of +5,700, and shrank the inventory loss from Rs -42,680 to Rs -14,110. The chart shows what disciplined inventory looks like over a full session.
# Plot inventory and cumulative P&L (spread vs total) for a market maker over one session.
import os
from pathlib import Path

import matplotlib

matplotlib.use("Agg")
import matplotlib.pyplot as plt
import numpy as np
import seaborn as sns
from openalgo import api

client = api(
    api_key=os.getenv("OPENALGO_API_KEY", "your_api_key_here"),
    host=os.getenv("OPENALGO_HOST", "http://127.0.0.1:5000"),
)

np.random.seed(7)  # deterministic sim; seed kept for reproducibility

SYMBOL, DAY = "RELIANCE", "2026-06-25"
HALF, CLIP, SKEW = 0.20, 100, 0.01
df = client.history(symbol=SYMBOL, exchange="NSE", interval="1m", start_date=DAY, end_date=DAY)
h, l, c = df["high"].values, df["low"].values, df["close"].values

cash, inv, spread, mid = 0.0, 0, 0.0, c[0]
inv_path, spread_path, total_path = [], [], []
for i in range(len(c)):
    bid = mid - HALF - SKEW * (inv / CLIP)
    ask = mid + HALF - SKEW * (inv / CLIP)
    if l[i] <= bid:
        cash -= bid * CLIP; inv += CLIP; spread += (mid - bid) * CLIP
    if h[i] >= ask:
        cash += ask * CLIP; inv -= CLIP; spread += (ask - mid) * CLIP
    mid = c[i]
    inv_path.append(inv); spread_path.append(spread); total_path.append(cash + inv * c[i])

x = np.arange(len(c))
sns.set_theme(style="whitegrid")
fig, (ax1, ax2) = plt.subplots(2, 1, figsize=(9, 6.5), sharex=True)

ax1.axhline(0, color="#9a9a9a", lw=0.8)
ax1.fill_between(x, 0, inv_path, where=(np.array(inv_path) >= 0), color="#16a34a", alpha=0.35, label="long")
ax1.fill_between(x, 0, inv_path, where=(np.array(inv_path) < 0), color="#dc2626", alpha=0.35, label="short")
ax1.plot(x, inv_path, color="#334155", lw=0.9)
ax1.set_title(f"{SYMBOL} {DAY}: inventory the skew keeps near flat (shares held)")
ax1.set_ylabel("Inventory (shares)")
ax1.legend(loc="upper left")

ax2.plot(x, spread_path, color="#7c83ff", lw=1.4, label="spread captured (gross)")
ax2.plot(x, total_path, color="#dc2626", lw=1.4, label="net P&L (after inventory m2m)")
ax2.axhline(0, color="#9a9a9a", lw=0.8)
ax2.fill_between(x, spread_path, total_path, color="#dc2626", alpha=0.12)
ax2.set_title("Spread is steady income; the gap below it is inventory mark-to-market")
ax2.set_ylabel("Cumulative P&L (Rs)")
ax2.set_xlabel("1-minute bars")
ax2.legend(loc="lower left")

out = Path(__file__).with_suffix(".png")
plt.savefig(out, dpi=110, bbox_inches="tight")
print(f"{len(c)} bars: spread Rs {spread_path[-1]:+,.0f}, net Rs {total_path[-1]:+,.0f}, "
f"peak inventory {int(np.abs(inv_path).max()):,} shares. Saved {out.name}")375 bars: spread Rs +10,285, net Rs -3,825, peak inventory 1,400 shares. Saved 02_inventory_pnl_chart.png
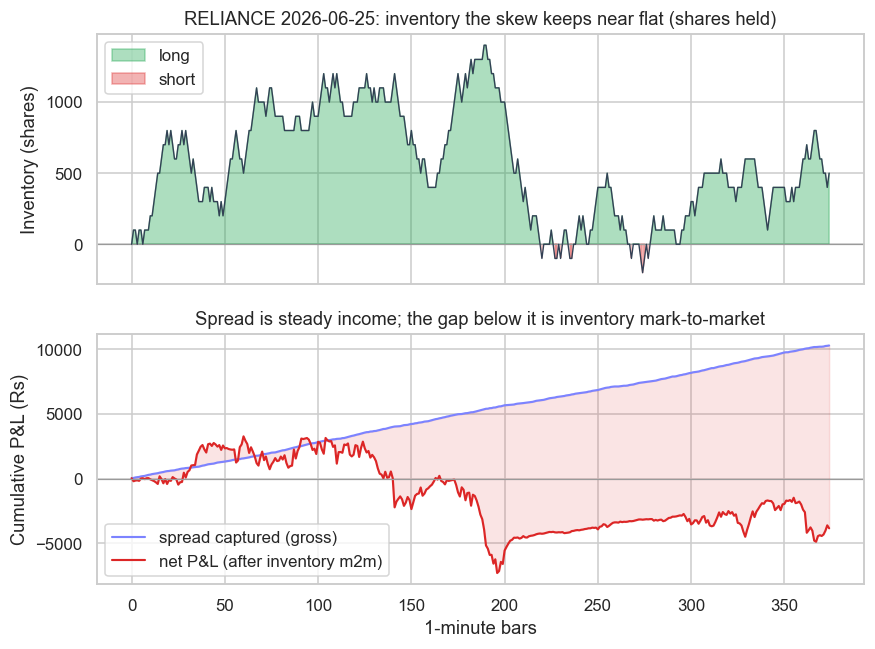
The top panel is the inventory the skew keeps oscillating around zero, never running away. The bottom panel is the punchline of the whole chapter: the spread P&L (the steadily rising line) is calm, near-linear income, while the net P&L wanders below it. That shaded gap between the two is the inventory mark-to-market - the cost of being on the wrong side of the flow. A market maker's job is to keep that gap thin.
This was a losing day even for the controlled maker, and that is honest. Single-name market making against a one-way trend is hard. Real makers survive by quoting many instruments so the directional risks net out, by widening the spread when volatility rises, and by hedging residual inventory in a correlated future. The skew buys you time; diversification and hedging do the rest.
Where this leaves a retail quant
You will not out-quote a colocated maker on a liquid index option - that race needs the speed and rebates of chapter 31. But the thinking here is universal. Any strategy that provides liquidity, leans on mean reversion, or holds a passive book is, in disguise, managing inventory against adverse selection. The decomposition of P&L into spread earned versus inventory carried is one of the most clarifying lenses in all of trading: it tells you whether you are being paid for a service or simply running an accidental directional bet.
We have now built and managed a quoting book by hand. The natural next questions are about the rules that govern doing this for real with an automated system - what the regulator permits, how orders are tagged, and what controls must sit between your code and the exchange. The next chapter turns to the SEBI framework for retail API algos, and the chapter after that to the kill switches and risk gates that keep an automated quoter from becoming an automated disaster.