Flow-Based Strategies: FII/DII, OI and Expiry
Trading the footprints of big money - FII and DII flows, open-interest shifts, the F&O ban list and the powerful Indian expiry-day effects.
- ·FII/DII flow signals
- ·Open-interest build-up
- ·The F&O ban as a signal
- ·Expiry-day effects
- ·Rollover analysis
- ·Combining flow signals
The previous chapter traded the calendar - the dates that force participants to act. This one trades the flows - the footprints those participants leave as they move. Every futures position has two sides, and the exchange counts them. Foreign funds report what they bought and sold. A stock that gets too crowded is frozen by rule. None of this is a prediction about price; it is a measurement of positioning, and positioning is the rawest signal a quant can read. The catch, which we will be honest about throughout, is that the cleanest of these signals do not live in the price feed at all - you have to go and fetch them, and some you cannot fetch at all.
Reading open interest
Open interest (OI) is the number of derivative contracts currently open - not traded today, but outstanding. Volume resets every morning; OI accumulates. When a new buyer and a new seller create a fresh contract, OI rises by one. When both sides close, OI falls. That single number, read alongside price, tells you whether money is entering or leaving a move, which is exactly what price alone cannot.
The standard reading is a 2x2 of price direction against OI direction:
The two build-up quadrants are conviction signals - new money is backing the move, so it has fuel. The two reduction quadrants are exhaustion signals - a rally on falling OI is shorts scrambling to cover rather than fresh buyers arriving, and it often fades. A single futures contract carries its own OI in its history, so we can label every day directly:
# Open-interest build-up: classify each day as longs building vs shorts building.
import os
from openalgo import api

client = api(
    api_key=os.getenv("OPENALGO_API_KEY", "your_api_key_here"),
    host=os.getenv("OPENALGO_HOST", "http://127.0.0.1:5000"),
)

LOT = 500  # RELIANCE lot size, so OI reads in lots
df = client.history(symbol="RELIANCE28JUL26FUT", exchange="NFO", interval="D",
                    start_date="2026-05-01", end_date="2026-06-28")
df["dprice"] = df["close"].diff()
df["doi"] = df["oi"].diff()


def classify(r):
    if r.dprice > 0 and r.doi > 0:
        return "Long build-up"
    if r.dprice < 0 and r.doi > 0:
        return "Short build-up"
    if r.dprice > 0 and r.doi < 0:
        return "Short covering"
    if r.dprice < 0 and r.doi < 0:
        return "Long unwinding"
    return "flat"


df["signal"] = df.apply(classify, axis=1)
recent = df.dropna().tail(12)

print(f"{'DATE':12s}{'CLOSE':>9s}{'dPRICE':>9s}{'OI(lots)':>11s}{'dOI%':>8s}  SIGNAL")
for ts, r in recent.iterrows():
    print(f"{ts.date()!s:12s}{r.close:>9.1f}{r.dprice:>9.1f}"
          f"{r.oi / LOT:>11,.0f}{r.doi / (r.oi - r.doi) * 100:>7.1f}%  {r.signal}")

counts = df["signal"].value_counts()
longs = int(counts.get("Long build-up", 0))
shorts = int(counts.get("Short build-up", 0))
print(f"\nOver {len(df.dropna())} sessions: {longs} long build-up days (price up, OI up) "
f"vs {shorts} short build-up days (price down, OI up). Latest: {df['signal'].iloc[-1]}.")DATE CLOSE dPRICE OI(lots) dOI% SIGNAL 2026-06-10 1270.9 -13.8 30,132 12.0% Short build-up 2026-06-11 1273.7 2.8 31,614 4.9% Long build-up 2026-06-12 1307.1 33.4 32,280 2.1% Long build-up 2026-06-15 1319.0 11.9 33,720 4.5% Long build-up 2026-06-16 1337.4 18.4 33,918 0.6% Long build-up 2026-06-17 1341.6 4.2 35,342 4.2% Long build-up 2026-06-18 1338.6 -3.0 37,269 5.5% Short build-up 2026-06-19 1321.0 -17.6 46,511 24.8% Short build-up 2026-06-22 1334.2 13.2 52,658 13.2% Long build-up 2026-06-23 1316.2 -18.0 65,624 24.6% Short build-up 2026-06-24 1322.2 6.0 108,876 65.9% Long build-up 2026-06-25 1323.6 1.4 154,018 41.5% Long build-up Over 37 sessions: 14 long build-up days (price up, OI up) vs 22 short build-up days (price down, OI up). Latest: Long build-up.
Over the 37 sessions measured on the RELIANCE 28-Jul-26 future, 14 days were long build-up (price up, OI up) against 22 days of short build-up (price down, OI up) - a market leaning net short into the contract. The mechanics show clearly: on 19 June price fell 17.6 points while OI jumped 24.8 percent, textbook fresh shorting; on 12 June price rose 33.4 points as OI added 2.1 percent, longs stepping in.
A single contract's OI rises mechanically through its life as it moves from far month to near month and absorbs rollover - notice the run had zero OI-down days. So the honest, clean signal here is long build-up versus short build-up (both on rising OI). To see covering and unwinding you read the expiring front month, or the OI aggregated across all expiries, not one young contract.
FII and DII flows
The largest footprints belong to two groups. FIIs (foreign institutional investors, now formally FPIs) move India's large-caps with global risk appetite. DIIs (domestic institutions - mutual funds, insurers) are the structural counterweight, funded by steady monthly SIP inflows. The exchanges publish provisional FII and DII cash-segment figures every evening, plus participant-wise OI in the derivatives segment, and these are the most-watched flow numbers in the country.
The honest part: those numbers are not in the price feed. client.history gives you price, volume and OI, but not "FIIs sold 3,200 crore today." That data comes from the exchange's daily participant-wise reports and provisional flow files, which you must ingest separately. Treat FII/DII flow as an external dataset joined to your price series by date, not something the market API hands you.
And treat it gently. Provisional cash flow is revised, it lumps index and stock together, and a single day is noise. The signal is in the persistence - a multi-week stretch of foreign selling is a genuine headwind on large-caps, and DII buying into FII selling tells you who is absorbing the supply. The participant-wise F&O OI (how net-long or net-short FIIs are in index futures) is often the sharper read, because it is positioning rather than a settled cash figure.
Build flow signals from changes and streaks, not levels. "FIIs net sellers for nine of the last ten sessions" is a regime; "FIIs sold today" is a coin flip. Always confirm a flow signal against price - flows that the tape ignores are flows you can ignore too.
The F&O ban list as a signal
When a stock's market-wide open interest crosses 95 percent of the market-wide position limit (MWPL), the exchange bars all new F&O positions in it the next day - you may only reduce. The stock enters the F&O ban list (introduced in Chapter 23 as a microstructure rule) until its OI falls back below 80 percent. This is a published daily list, again external to the price API.
As a signal it is double-edged, and reading it wrong is expensive. A ban means the contract is extremely crowded. Forced to unwind into a market that allows no fresh hedging, a banned stock often sees violent, illiquid moves - sometimes a capitulation that marks the end of the trend, sometimes a squeeze that extends it. The disciplined use is not "buy the ban" or "sell the ban" but risk management: a name on the ban list has thin two-way liquidity and distorted price action, so size down, widen stops, and never assume the future will track the cash cleanly while the ban holds.
Expiry and rollover
Flows have a clock. Indian stock and index F&O settle on a fixed weekly and monthly cadence (NSE and NFO settle Tuesday), and the approach to expiry reshapes the book. Two effects dominate. First, pinning: as theta crushes option value, price is drawn toward strikes with the heaviest open interest, because option writers hedge to defend them - the more we covered in Chapter 56 on derivatives microstructure. Second, and more measurable, is rollover - the migration of open positions from the expiring contract to the next one.
Rollover is visible directly in OI. As the front month dies, its OI bleeds away while the next month's OI swells. Plotting price against OI for the incoming contract shows the build:
# Plot a stock future's price against its open interest to read build-up and rollover.
import os
from pathlib import Path

import matplotlib

matplotlib.use("Agg")
import matplotlib.pyplot as plt
import seaborn as sns
from openalgo import api

client = api(
    api_key=os.getenv("OPENALGO_API_KEY", "your_api_key_here"),
    host=os.getenv("OPENALGO_HOST", "http://127.0.0.1:5000"),
)

LOT = 500
df = client.history(symbol="RELIANCE28JUL26FUT", exchange="NFO", interval="D",
                    start_date="2026-06-01", end_date="2026-06-28")
df["oi_lots"] = df["oi"] / LOT

sns.set_theme(style="whitegrid")
fig, ax1 = plt.subplots(figsize=(9, 4.8))

ax2 = ax1.twinx()
ax2.bar(df.index, df["oi_lots"], width=0.8, color="#c9ccff", label="Open interest")
ax2.grid(False)
ax1.plot(df.index, df["close"], color="#7c83ff", lw=2, label="Close")

ax1.set_zorder(ax2.get_zorder() + 1)
ax1.patch.set_visible(False)
ax1.set_ylabel("Price (Rs)")
ax2.set_ylabel("Open interest (lots)")
ax1.set_title("RELIANCE 28-Jul-26 future: price vs open interest")

peak = df["oi_lots"].idxmax()
ax1.annotate("rollover build-up", xy=(peak, df.loc[peak, "close"]),
             xytext=(-95, 28), textcoords="offset points",
             color="#16a34a", fontsize=9, fontweight="bold",
             arrowprops=dict(arrowstyle="->", color="#16a34a"))

out = Path(__file__).with_suffix(".png")
plt.savefig(out, dpi=110, bbox_inches="tight")

oi_chg = (df["oi_lots"].iloc[-1] / df["oi_lots"].iloc[0] - 1) * 100
print(f"OI rose {oi_chg:+.0f}% over the window to {df['oi_lots'].iloc[-1]:,.0f} lots "
f"while price went {df['close'].iloc[0]:.0f} -> {df['close'].iloc[-1]:.0f}. Saved {out.name}")OI rose +823% over the window to 154,018 lots while price went 1333 -> 1324. Saved 02_price_oi_chart.png
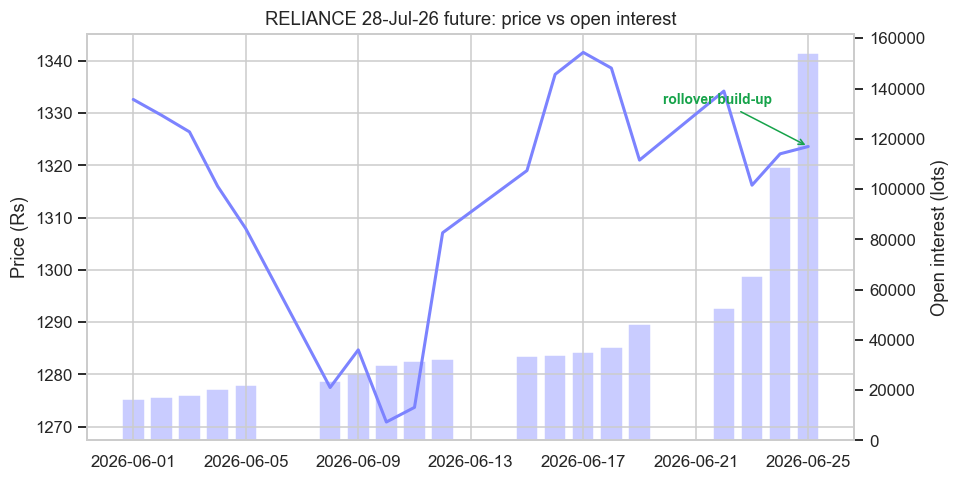
Across June the RELIANCE 28-Jul-26 future's OI rose 823 percent to 154,018 lots while price barely moved, from about 1,333 to 1,324. That combination - OI exploding on a flat price - is the signature of rollover and fresh positioning rather than a directional bet: traders are carrying their books into the new contract, not chasing a move. The late surge is unmistakable, OI adding 65.9 percent on 24 June and 41.5 percent on 25 June as the deadline neared. A high rollover percentage (much of the prior OI carried forward) signals conviction that the trade should continue; a low one signals participants are letting positions expire and stepping aside.
Rollover cost - the spread between the expiring and next contract you pay to roll - is a small, recurring, and measurable drag. Quote both contracts near expiry, compute the roll spread in basis points of carry (Chapter 50), and bake it into any strategy that holds futures across the settlement boundary. Ignoring it is a classic backtest lie.
Combining flow signals
No single flow signal is reliable alone; their power is in confluence. Each is noisy in isolation and each points at the same underlying question - is real, committed money entering or leaving. When several agree, the read is far stronger than any one of them.
A bearish confluence: persistent FII cash selling, and net short build-up in the stock or index future (price down on rising OI), and a crowded name slipping toward the ban list. A bullish confluence: FII buying and DII support together, long build-up on the futures, healthy rollover into the new month. The craft is to score each flow as a simple signed input, require agreement before acting, and always let price be the final arbiter - positioning that the tape refuses to confirm is a trap, not a trade.
Flow strategies do not forecast price; they measure who is forced or committed to act, and lean the same way. Open interest splits every move into build-up (fueled) or reduction (exhausted); FII/DII flows and the F&O ban list say who is positioned where; expiry and rollover put a clock on all of it. The edge is real but the data is scattered - price and OI come from the feed, flows and the ban list you must fetch yourself - so be honest about what you can actually measure.
We have now read the slow footprints of large players. The next chapter zooms all the way in to the trading day itself - intraday mean reversion and breakout models, where the clock runs in minutes and microstructure costs decide who survives.