Intraday Mean Reversion and Breakout Models
The two intraday archetypes - fading stretched moves and riding confirmed breakouts - built with real intraday data and honest costs.
- ·Intraday mean reversion
- ·Opening-range breakout
- ·VWAP reversion
- ·Time-of-day effects
- ·Stops and targets
- ·Intraday cost reality
A stock opens, ticks for fifteen minutes, then snaps above the high of that range and runs. To one trader that is a breakout - the start of a trend, buy it. To another it is an overextension - price stretched too far from fair value, fade it. Both are looking at the same five-minute bar, and on any given day one of them is right and the other is feeding them. Intraday trading is the art of knowing which regime you are in, and the brutal arithmetic of paying for the privilege of guessing. This chapter builds two of the oldest intraday models in the book - mean reversion and the opening-range breakout - on real Indian data, and then subtracts the costs that quietly decide whether either one is a business or a hobby.
Two opposite reflexes: reversion and breakout
Strip away the jargon and intraday alpha comes from two opposite beliefs about what a price move means.
Mean reversion says that over short horizons, price oscillates around a fair value and extreme moves snap back. The fair value most intraday traders anchor to is VWAP - the volume-weighted average price, the running average of price weighted by how much volume traded at each level, reset each session at 09:15. VWAP is the day's centre of gravity. It is the price the big institutional algos benchmark their fills against, so it has real gravitational pull: stretch too far above it and there is a natural seller, too far below and a natural buyer. A reversion trade sells the stretch and targets the snap back to the line.
Breakout (or momentum) says the opposite: a decisive move out of a range is information, the visible start of a larger imbalance, and you should join it rather than fade it. The cleanest expression is the opening-range breakout (ORB): mark the high and low of the first 15 or 30 minutes - the period when overnight news and order imbalance get digested - then trade the first decisive break of that range.
Reversion and breakout are not contradictory strategies; they are bets on different regimes. Quiet, rangebound, high-liquidity days reward fading VWAP. Trending, news-driven, expansion days reward riding the break. The hard part is not the entry rule - it is classifying the day, and accepting you will be wrong often.
The opening-range breakout, built on real bars
Let us make the ORB concrete on the most recent NIFTY session in the data. The rule is mechanical: take the first three 5-minute bars (09:15, 09:20, 09:25) as the opening range, enter on the first bar that closes beyond that range, place the stop at the far side of the range, and target a move equal to the range width (a 1R target, where R is the risk you put up). Then walk the rest of the day bar by bar and let the stop or target decide the outcome.
# Opening-range breakout on NIFTY 5m: define the first 15m range, trade the break, net of costs.
import os
import time

from openalgo import api

client = api(
    api_key=os.getenv("OPENALGO_API_KEY", "your_api_key_here"),
    host=os.getenv("OPENALGO_HOST", "http://127.0.0.1:5000"),
)


def history(symbol, exchange, interval, start, end):
    for _ in range(4):  # history() can return a transient error dict; retry
        r = client.history(symbol=symbol, exchange=exchange, interval=interval,
                           start_date=start, end_date=end)
        if hasattr(r, "index"):
            return r
        time.sleep(1)
    raise SystemExit("no data")


df = history("NIFTY", "NSE_INDEX", "5m", "2026-06-22", "2026-06-28")
day = sorted(set(df.index.date))[-1]                     # most recent trading day
d = df[df.index.date == day].copy()

# Opening range = first 15 minutes (three 5m bars: 09:15, 09:20, 09:25).
opening = d.iloc[:3]
or_high, or_low = opening["high"].max(), opening["low"].min()
width = or_high - or_low
rest = d.iloc[3:]

# Entry: first 5m bar that CLOSES beyond the range. Stop = far side of range, target = 1x range.
side = entry = entry_t = i_entry = None
for i, (t, row) in enumerate(rest.iterrows()):
    if row["close"] > or_high:
        side, entry, entry_t, i_entry = "LONG", row["close"], t, i
        break
    if row["close"] < or_low:
        side, entry, entry_t, i_entry = "SHORT", row["close"], t, i
        break

stop = or_low if side == "LONG" else or_high
target = entry + width if side == "LONG" else entry - width

# Walk the rest of the day; first touch of stop or target wins, else exit at the close.
exit_px = exit_t = reason = None
for t, row in rest.iloc[i_entry + 1:].iterrows():
    hit_stop = row["low"] <= stop if side == "LONG" else row["high"] >= stop
    hit_tgt = row["high"] >= target if side == "LONG" else row["low"] <= target
    if hit_stop:
        exit_px, exit_t, reason = stop, t, "STOP"
        break
    if hit_tgt:
        exit_px, exit_t, reason = target, t, "TARGET"
        break
if exit_px is None:
    exit_px, exit_t, reason = d["close"].iloc[-1], d.index[-1], "CLOSE"

gross_pts = (exit_px - entry) if side == "LONG" else (entry - exit_px)

# The brutal intraday cost reality: one NIFTY future lot (65), ~1 pt slippage per side, ~Rs 930 fees.
LOT, SLIP_PTS, FEES = 65, 1.0, 930.0
cost_pts = 2 * SLIP_PTS + FEES / LOT
net_pts = gross_pts - cost_pts
gross_rs, net_rs = gross_pts * LOT, net_pts * LOT

print(f"Day {day}  opening range {or_low:.2f} - {or_high:.2f}  (width {width:.1f} pts)")
print(f"{side} entry {entry:.2f} @ {entry_t.time()}   stop {stop:.2f}   target {target:.2f}")
print(f"Exit {exit_px:.2f} @ {exit_t.time()} ({reason})   gross {gross_pts:+.1f} pts = Rs {gross_rs:+,.0f}")
print(f"Cost {cost_pts:.1f} pts (slippage + fees) eats {cost_pts / gross_pts * 100:.0f}% of the move")
print(f"NET {net_pts:+.1f} pts = Rs {net_rs:+,.0f} per lot (breakeven needs > {cost_pts:.1f} pts)")Day 2026-06-25 opening range 24107.80 - 24169.70 (width 61.9 pts) LONG entry 24172.30 @ 09:50:00 stop 24107.80 target 24234.20 Exit 24234.20 @ 11:55:00 (TARGET) gross +61.9 pts = Rs +4,024 Cost 16.3 pts (slippage + fees) eats 26% of the move NET +45.6 pts = Rs +2,964 per lot (breakeven needs > 16.3 pts)
On 25 June 2026 the opening range was 24107.80 to 24169.70, a width of 61.9 points. Price closed above the high at 09:50 and we went long at 24172.30, stop at the range low, target one range-width higher at 24234.20. The target printed at 11:55 for a gross gain of +61.9 points, Rs 4,024 on one lot of 65. A clean winner - and exactly the kind of result that gets screenshotted and sold as a course.
Now read the next line of the output, because it is the whole point of the chapter.
The brutal cost reality
Trading one NIFTY future lot costs roughly Rs 930 in all-in charges for the round trip - brokerage, exchange and clearing fees, stamp duty, securities transaction tax and the GST on top. Add about one point of slippage on each side, because a breakout fills you a tick worse than the print you reacted to, and on a 65-unit lot that is another Rs 130. Spread across the lot, the round trip costs 16.3 points before you are even. On our winning trade, costs ate 26 percent of the gross move, turning +61.9 points into +45.6 net, Rs 2,964 instead of Rs 4,024.
That was a good day. The terror of intraday trading is the median day, where the breakout fires, runs ten points, stalls, and reverses. Your gross is +10; your cost is 16.3; your net is negative even though you were right about direction. The breakeven is not zero - it is sixteen points away, every single time.
Costs are not a footnote to an intraday strategy; they are the strategy's main adversary. A signal with a genuine but small edge - say an average +12 points per trade gross - is a guaranteed loser at a 16-point breakeven. Always backtest net, size the move you actually need to clear costs, and treat any edge thinner than two round trips with deep suspicion.
This is also why intraday edges have such low capacity for the retail account and such fierce competition at the institutional end. The professional desk pays a fraction of your costs and benchmarks to VWAP precisely so it can trade the thin edges you cannot. You are not playing the same game at the same table.
VWAP reversion, and the day that flips
The breakout is only half the picture. Watch what the same opening break does on a different instrument the same day. Here is RELIANCE on 25 June 2026, with the opening-range box, the session VWAP, and the two events marked.
# Intraday day chart: opening-range box, session VWAP, and the breakout that faded back to VWAP.
import os
import time
from pathlib import Path

import matplotlib

matplotlib.use("Agg")
import matplotlib.dates as mdates
import matplotlib.pyplot as plt
import numpy as np
import seaborn as sns
from openalgo import api, ta

client = api(
    api_key=os.getenv("OPENALGO_API_KEY", "your_api_key_here"),
    host=os.getenv("OPENALGO_HOST", "http://127.0.0.1:5000"),
)


def history(symbol, exchange, interval, start, end):
    for _ in range(4):
        r = client.history(symbol=symbol, exchange=exchange, interval=interval,
                           start_date=start, end_date=end)
        if hasattr(r, "index"):
            return r
        time.sleep(1)
    raise SystemExit("no data")


SYM = "RELIANCE"
df = history(SYM, "NSE", "5m", "2026-06-22", "2026-06-28")
day = sorted(set(df.index.date))[-1]
d = df[df.index.date == day].copy()
d.index = d.index.tz_localize(None)            # plot in local IST clock time
d["vwap"] = np.asarray(ta.vwap(d["high"], d["low"], d["close"], d["volume"]))

# Opening range (first 15 minutes) and the first close beyond it.
or_high, or_low = d.iloc[:3]["high"].max(), d.iloc[:3]["low"].min()
rest = d.iloc[3:]
bo_t = bo_px = None
for i, (t, row) in enumerate(rest.iterrows()):
    if row["close"] > or_high or row["close"] < or_low:
        bo_t, bo_px, bo_i = t, row["close"], i
        break

# Reversion: first bar after the breakout where price closes back through VWAP.
rev_t = rev_px = None
for t, row in rest.iloc[bo_i + 1:].iterrows():
    if (bo_px > or_high and row["close"] < row["vwap"]) or (bo_px < or_low and row["close"] > row["vwap"]):
        rev_t, rev_px = t, row["close"]
        break

sns.set_theme(style="whitegrid")
fig, ax = plt.subplots(figsize=(8.5, 4.6))
ax.plot(d.index, d["close"], color="#7c83ff", lw=1.5, label="price (5m close)")
ax.plot(d.index, d["vwap"], color="#16a34a", lw=1.6, ls="--", label="session VWAP")
ax.axhspan(or_low, or_high, color="#9a9a9a", alpha=0.18)
ax.axhline(or_high, color="#9a9a9a", lw=1)
ax.axhline(or_low, color="#9a9a9a", lw=1)
ax.text(d.index[0], or_high, " opening range", va="bottom", fontsize=8, color="#555")
ax.scatter([bo_t], [bo_px], color="#16a34a", s=90, zorder=5, marker="^", label="breakout")
if rev_t is not None:
    ax.scatter([rev_t], [rev_px], color="#dc2626", s=90, zorder=5, marker="v", label="VWAP reversion")
ax.xaxis.set_major_formatter(mdates.DateFormatter("%H:%M"))
ax.set_title(f"{SYM} {day}  -  opening-range breakout that faded back through VWAP")
ax.set_ylabel("Price (Rs)")
ax.legend(loc="upper right", fontsize=8)

out = Path(__file__).with_suffix(".png")
plt.savefig(out, dpi=110, bbox_inches="tight")
print(f"{SYM} {day}: OR {or_low:.1f}-{or_high:.1f}, broke up @ {bo_t.time()} ({bo_px:.1f}), "
f"reverted below VWAP @ {rev_t.time()} ({rev_px:.1f}), closed {d['close'].iloc[-1]:.1f}. Saved {out.name}")RELIANCE 2026-06-25: OR 1316.8-1324.0, broke up @ 09:50:00 (1326.2), reverted below VWAP @ 11:25:00 (1322.9), closed 1316.5. Saved 02_vwap_reversion_chart.png
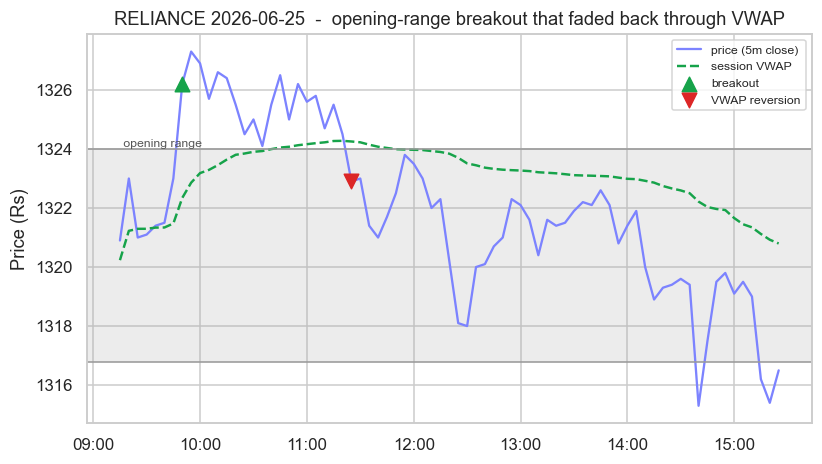
The script tells the story in one line: RELIANCE broke up out of its 1316.8 to 1324.0 opening range at 09:50, tagging 1326.2 - an ORB long, just like NIFTY. But it stalled, and by 11:25 price had slipped back below VWAP at 1322.9. That cross back through the centre of gravity is the reversion signal: the breakout failed, the buyers were exhausted, and the day reverted. From there the stock drifted lower all afternoon to close at 1316.5, back at the bottom of the morning range. The breakout trader lost; the VWAP-reversion trader, who shorted the failure back below the line, won.
A failed breakout is one of the highest-quality reversion setups there is. When price breaks a level, sucks traders in, then closes back inside, the trapped longs become forced sellers. "Break, fail, fade back through VWAP" is a single chartable pattern that links both models on one screen.
Time of day is a feature, not a backdrop
Intraday behaviour is not stationary across the session, and ignoring the clock throws away real signal. The first 30 to 45 minutes carry the widest ranges and the most directional energy as overnight information clears, which is exactly why the opening range is worth marking. The middle of the day, roughly 11:30 to 14:00, tends to be quieter, lower-volume and more rangebound, which is when VWAP reversion behaves best and breakouts most often fail for lack of follow-through. The last hour brings position-squaring and, near expiry, gamma-driven moves that can trend hard into the close.
A practical rule many intraday desks encode directly: take breakouts in the opening session, fade extensions in the midday lull, and tighten or stand aside in the final minutes unless you are explicitly trading the close. The same entry signal carries a different expectancy at 09:45 than at 13:15. Treat the time of day as an input to the model, not a constant.
Stops and targets deserve the same regime-awareness. A fixed point stop is naive because volatility changes through the day and across days; size your stop to the morning range or to a multiple of the average true range (Chapter 43) so it breathes with conditions. And whatever the model, the position must be flat by the close unless you are deliberately carrying overnight risk - an intraday edge that needs a gap in your favour to survive is not an intraday edge.
Recap
- Intraday alpha comes from two opposite reflexes: breakout (a decisive move is information, join it) and mean reversion (an extreme stretch from fair value snaps back, fade it). They are bets on different regimes, not rival truths.
- The opening-range breakout marks the first 15 to 30 minutes, enters on the close beyond the range, stops at the far side and targets the range width. On NIFTY for 25 June 2026 it made a clean +61.9 gross points.
- VWAP is the session's volume-weighted centre of gravity and the natural anchor for reversion. On RELIANCE the same day, the opening break failed and faded back through VWAP, turning a breakout into a textbook short.
- The cost reality is brutal: a NIFTY lot round trip is about 16.3 points all-in, which ate 26 percent of even our winning trade and is a guaranteed loss on any move thinner than the breakeven. Always model net.
- Time of day is a feature - breakouts favour the open, reversion favours the midday lull - and stops should scale with volatility, with the book flat by the close.
We have now built directional intraday models. Next we leave price-only signals behind and ask what text can tell us, with alternative data and NLP for Indian markets - and the same discipline applies: an edge is only real once it survives honest, net-of-cost testing.