Look-Ahead, Survivorship and Corporate-Action Bias
The three biases that silently inflate every naive backtest - using the future, ignoring the dead, and mishandling splits and bonuses.
- ·Look-ahead bias
- ·Survivorship bias
- ·Corporate-action adjustment
- ·Point-in-time data
- ·Index reconstitution bias
- ·Auditing a dataset
The previous chapter was about how you test a strategy. This one is about something more insidious - the data itself can be a lie before you write a single line of strategy code. A price series looks like an innocent column of numbers, but it carries hidden assumptions about what was knowable when, which names were in the universe, and how a stock's history was stitched together across splits and bonuses. Three biases live in that data - look-ahead, survivorship, and corporate-action - and each one quietly hands your backtest information the live market would never have given it. Master these and you remove the most common reason a beautiful backtest dies in production.
Look-ahead bias: the bar you cannot have yet
Look-ahead bias is using, at time t, any information that only became available after t. Chapter 67 showed the canonical version - forgetting to lag a signal. Here we go deeper, because look-ahead hides in places far subtler than a missing shift. It hides whenever a number you feed the model on a given date was not actually settled on that date.
Start with the cleanest case so the mechanism is unmistakable. Take a plain 10-day momentum signal on NIFTY - long when today sits above its level ten sessions ago - and score it two ways. The leaked version uses today's close to build the signal and then collects today's close-to-close return, so the same price appears on both sides of the equation. The honest version lags the signal by one bar, the way real trading forces you to.
# Look-ahead bias: scoring a momentum signal on the SAME bar inflates its hit rate.
import os
from datetime import datetime

import numpy as np
from openalgo import api

client = api(
    api_key=os.getenv("OPENALGO_API_KEY", "your_api_key_here"),
    host=os.getenv("OPENALGO_HOST", "http://127.0.0.1:5000"),
)

end = datetime.now().strftime("%Y-%m-%d")
c = client.history(symbol="NIFTY", exchange="NSE_INDEX", interval="D",
                   start_date="2018-01-01", end_date=end)["close"]
r = c.pct_change()

# A 10-day momentum signal: long if today is above its level 10 sessions ago.
signal = np.sign(c - c.shift(10))


def hit_and_mean(pnl):
    pnl = pnl.dropna()
    hit = (pnl > 0).mean() * 100
    return hit, pnl.mean() * 1e4   # average return in basis points per day


# Leaked: today's close is in the signal AND in the return it is scored against.
leak_hit, leak_bp = hit_and_mean(signal * r)
# Honest: yesterday's signal decides, the position then earns today's return.
true_hit, true_bp = hit_and_mean(signal.shift(1) * r)

print(f"Leaked  (scored on same bar) : hit rate {leak_hit:5.1f}%   avg {leak_bp:+6.1f} bp/day   <- fantasy")
print(f"Honest  (prior bars only)    : hit rate {true_hit:5.1f}%   avg {true_bp:+6.1f} bp/day   <- reality")
print(f"\nOne .shift(1) erased {leak_hit - true_hit:.1f} points of hit rate. The 'edge' was the leak.")Leaked (scored on same bar) : hit rate 61.1% avg +22.3 bp/day <- fantasy Honest (prior bars only) : hit rate 53.0% avg +2.1 bp/day <- reality One .shift(1) erased 8.1 points of hit rate. The 'edge' was the leak.
The leaked signal posts a 61.1% hit rate and +22.3 bp per day. Lag it correctly and the hit rate falls to 53.0% with +2.1 bp per day - one .shift(1) erased 8.1 points of hit rate and almost all of the return. There was never an edge; there was a column of today's prices being used to predict today.
Look-ahead is not only a coding bug. It is baked into data when fields are restated. Reported earnings, index membership, free-float weights, and even "adjusted" prices are often stored as their final, revised values - not the messy first prints that were actually visible on the day. A backtest that reads tomorrow's correction today will look prophetic and trade like a fool.
Other common leaks: normalising returns with the full-sample mean and standard deviation (your z-score at the start of history secretly knows the next decade's volatility); using a session's high or low as an intraday trigger when you could only know it after the bar closed; and joining a fundamentals table on report date rather than the later date the filing was genuinely public.
Plotted, the leak is grotesque. The same momentum rule grows one rupee to 94.8x when it peeks, and to just 1.37x when it does not - and the leaked curve climbs in an almost ruler-straight line that no honest strategy ever produces.
# The leaked equity curve is implausibly smooth; the honest one just wanders.
import os
from datetime import datetime
from pathlib import Path

import matplotlib

matplotlib.use("Agg")
import matplotlib.pyplot as plt
import numpy as np
import seaborn as sns
from openalgo import api

client = api(
    api_key=os.getenv("OPENALGO_API_KEY", "your_api_key_here"),
    host=os.getenv("OPENALGO_HOST", "http://127.0.0.1:5000"),
)

end = datetime.now().strftime("%Y-%m-%d")
c = client.history(symbol="NIFTY", exchange="NSE_INDEX", interval="D",
                   start_date="2018-01-01", end_date=end)["close"]
r = c.pct_change()
signal = np.sign(c - c.shift(10))     # 10-day momentum

leaked = (1 + (signal * r).fillna(0)).cumprod()
honest = (1 + (signal.shift(1) * r).fillna(0)).cumprod()

sns.set_theme(style="whitegrid")
fig, ax = plt.subplots(figsize=(8, 4.5))
ax.plot(leaked.index, leaked, color="#dc2626", lw=1.8, label="leaked (scored on the same bar)")
ax.plot(honest.index, honest, color="#16a34a", lw=1.8, label="honest (prior bars only)")
ax.set_yscale("log")
ax.set_title("A signal scored on its own bar prints a fake, too-smooth equity curve")
ax.set_ylabel("Growth of 1, log scale (NIFTY 10-day momentum)")
ax.legend(loc="upper left")

out = Path(__file__).with_suffix(".png")
plt.savefig(out, dpi=110, bbox_inches="tight")
print(f"Leaked grows to {leaked.iloc[-1]:.1f}x; honest ends at {honest.iloc[-1]:.2f}x. Saved {out.name}")Leaked grows to 94.8x; honest ends at 1.37x. Saved 02_lookahead_equity.png
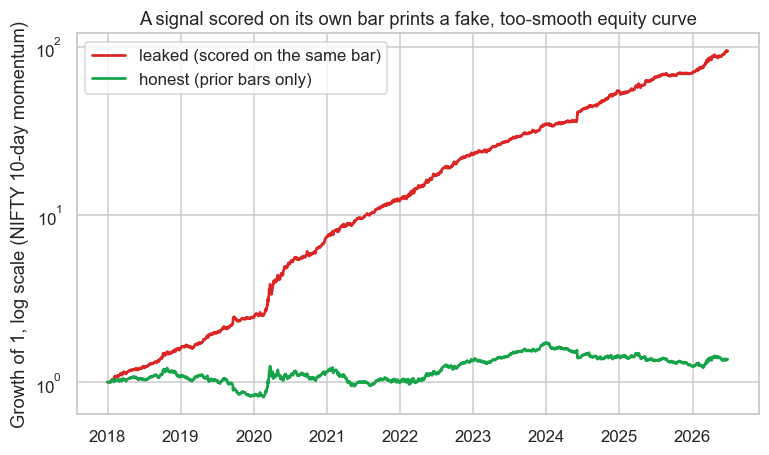
The smoothness is the tell. Real edges are lumpy - they have drawdowns, flat stretches and bad years. An equity curve that rises like a savings account with no meaningful pullbacks is almost always look-ahead in disguise. Train your eye to distrust beauty.
Corporate actions: when the price series itself lies
A stock's raw quoted price is not continuous through its life. Corporate actions - splits, bonus issues, rights, and dividends - put real discontinuities into the series that have nothing to do with profit or loss.
When a large-cap declares a 1:1 bonus, every holder gets one free share for each held, and the quoted price halves overnight. A 1:5 stock split divides the price by five. Nothing was lost - your wealth is unchanged - but an unadjusted series shows a clean minus 50% or minus 80% gap. Feed that to a momentum model and it screams "crash and sell". Feed it to a volatility estimator and your annualised vol spikes on a day nothing happened. The single bar wrecks every rolling statistic that touches it.
The fix is back-adjustment: multiply all prices before the ex-date by the corporate-action factor so the series is continuous in return space. For a 1:1 bonus you halve the pre-event prices; for dividends, a total-return adjustment removes the ex-dividend drop so a held position is credited the payout. This is why you almost always research on an adjusted series, and why you must know whether your feed delivers one.
Splits and bonuses change the price but not your wealth. Always backtest on a corporate-action-adjusted series, or every split and bonus in your universe will register as a phantom crash that corrupts momentum, volatility and stop-loss logic alike.
But adjustment has a sting in its tail, and it is pure look-ahead. The adjusted price you download today bakes in the cumulative factor of every split that ever happened, including ones that came after the date you are simulating. If your strategy keys off a round number - "buy near 1,000" - the adjusted history may show that level being crossed years before the stock, in its un-adjusted real life, traded anywhere near it. The honest approach is point-in-time adjustment: at each simulated date, apply only the factor that was known by then.
Survivorship and index-reconstitution bias
Survivorship bias is testing on the names that made it. Build a universe from today's NIFTY 50 or NIFTY 500 and run it back ten years, and you have silently dropped every company that was delisted, merged away, or fell out of the index after a collapse. You are testing only the winners, and almost any strategy looks brilliant on a basket pre-selected for not dying.
Closely related is index-reconstitution bias. The NIFTY indices are reviewed and rebalanced periodically, with constituents added and removed. A name enters because it has grown strong and exits because it has weakened. Backtesting on the current member list therefore front-runs years of additions you could not have known about and skips the laggards that were actually in the index at the time. The membership list is itself a leaked, forward-looking signal.
The cure for both is a point-in-time universe: at each historical date, trade the constituents and weights that were genuinely in force on that date, delisted and demoted names included. It is unglamorous data work - sourcing historical membership and corporate-action calendars - but it is the difference between a number you can trust and one you cannot.
You can feel survivorship bias even on an index level. NIFTY's own long-run chart looks relentlessly upward partly because the index machinery keeps swapping faltering members for thriving ones. The index is a managed, survivorship-selected portfolio, not a fixed basket - bear that in mind before treating its history as a neutral benchmark.
Auditing a dataset before you trust it
Before a single backtest, audit the data the way an analyst audits accounts. A quick checklist that catches most of the damage:
- Overnight gaps: flag any close-to-close jump beyond, say, 15%. Most are unadjusted splits, bonuses or rights, not real moves.
- Frozen or zero rows: constant prices, zero volume, or duplicated timestamps signal stitching errors or holidays leaking in.
- As-of timestamps: for any fundamental or membership field, store when it became public, not the event date, and join on that.
- Delisted names present?: if your historical universe contains only currently-listed tickers, it is survivorship-biased by construction.
- Adjusted or not, and how: confirm whether prices are raw or back-adjusted, and whether the adjustment is point-in-time or full-history.
Run that audit once and you will be amazed how often a "great" strategy was quietly feeding on a data artefact.
Bringing it together
Look-ahead, survivorship and corporate-action bias share one root: the dataset knows something the live market did not. Lag every signal so it sits strictly to the left of now; adjust for splits and bonuses but only with information available at the time; and trade a point-in-time universe that still contains the companies that failed. Do that, and your backtest finally describes a world you could actually have traded in. Next we make the evaluation equally honest, with walk-forward testing, purged cross-validation and the deflated Sharpe ratio - the methods that stop time-series leakage from sneaking back in through the validation door.