Currency and Interest-Rate Derivatives
Beyond equities - USD-INR and cross-currency futures and options, interest-rate futures, and how a quant uses them for macro and hedging.
- ·Currency futures and options
- ·USD-INR microstructure
- ·Interest-rate futures (IRF)
- ·The yield curve basics
- ·Macro hedging uses
- ·Liquidity and limits
An equity quant who ignores the rupee and the rate curve is trading with one eye shut. The level of NIFTY, the premium on a stock future, the cost of carrying any position - every one of them is wired to two macro variables that trade in their own pits: the price of a dollar in rupees, and the price of money itself. India runs a dedicated currency segment and a thin but real interest-rate futures market precisely so this risk can be priced and hedged on a transparent, centrally-cleared exchange. This chapter is the bridge from the equity-derivatives world of the last few chapters to the macro book that sits underneath every Indian portfolio.
The currency segment: USD-INR and its cousins
Exchange-traded currency derivatives live on the CDS segment (currency derivatives segment), regulated jointly by SEBI and the RBI - the one corner of Indian markets where the securities regulator and the central bank share the rule book. The flagship is the USD-INR future: a contract to exchange dollars for rupees at a rate fixed today, for delivery on a future date. Each contract is 1000 dollars, quoted in rupees per dollar, and ticks in quarter-paise steps of 0.0025. Trading alongside it are EUR-INR, GBP-INR and JPY-INR futures, a set of cross-currency contracts that never touch the rupee at all (EUR-USD, GBP-USD, USD-JPY), and options on USD-INR. The currency day runs longer than the equity day, out to 5 pm, because the dollar never really sleeps.
Let's pull a live USD-INR future and watch how it actually behaves.
# USD-INR currency future: level, daily range and how its vol compares to equity.
import os

import numpy as np
from openalgo import api

client = api(
    api_key=os.getenv("OPENALGO_API_KEY", "your_api_key_here"),
    host=os.getenv("OPENALGO_HOST", "http://127.0.0.1:5000"),
)

# Find the live USD-INR futures on the currency segment (CDS) and keep the
# contract with the deepest daily history (the liquid monthly future).
hits = client.search(query="USDINR", exchange="CDS")["data"]
futs = [h["symbol"] for h in hits if h["instrumenttype"] == "FUT"]

best, usd = None, None
for sym in futs:
    df = client.history(symbol=sym, exchange="CDS", interval="D",
                        start_date="2025-06-28", end_date="2026-06-28")
    if hasattr(df, "shape") and (usd is None or len(df) > len(usd)):
        best, usd = sym, df

nif = client.history(symbol="NIFTY", exchange="NSE_INDEX", interval="D",
                     start_date="2025-06-28", end_date="2026-06-28")


def ann_vol(df):
    r = np.log(df["close"] / df["close"].shift(1)).dropna()
    return r.std() * np.sqrt(252) * 100


usd_last = usd["close"].iloc[-1]
usd_range = usd["high"].iloc[-1] - usd["low"].iloc[-1]
usd_vol, nif_vol = ann_vol(usd), ann_vol(nif)

print(f"Contract             : {best} (CDS)")
print(f"USD-INR last close   : {usd_last:.4f}")
print(f"Last day's range     : {usd_range:.4f}  ({usd_range / usd_last * 100:.2f}% of level)")
print(f"Annualised vol       : {usd_vol:.2f}%   ({len(usd)} daily bars)")
print(f"NIFTY annualised vol : {nif_vol:.2f}%")
print(f"Equity vol / FX vol  : {nif_vol / usd_vol:.1f}x")
print()
print("The rupee is a managed, low-vol macro variable: USD-INR realises a fraction")
print("of equity-index volatility, which is why it is hedged rather than chased.")Contract : USDINR29JUL26FUT (CDS) USD-INR last close : 94.7000 Last day's range : 0.3750 (0.40% of level) Annualised vol : 5.54% (219 daily bars) NIFTY annualised vol : 13.14% Equity vol / FX vol : 2.4x The rupee is a managed, low-vol macro variable: USD-INR realises a fraction of equity-index volatility, which is why it is hedged rather than chased.
The number that should jump out is the volatility. Over the last 219 trading days the front USD-INR future (last trading near 94.70, with a typical daily range under half a percent) realised about 5.54% annualised, against NIFTY's 13.14% - the equity index is roughly 2.4 times as volatile as the currency. That gap is not an accident. It is the signature of a managed market.
The rupee is a low-volatility macro variable by design. USD-INR realises a fraction of equity-index volatility, which is why a quant hedges currency risk rather than chasing it for directional alpha - the move is usually too small, too slow, and too policy-driven to trade like a stock.
USD-INR microstructure: a managed, narrow market
Why is the rupee so quiet? Because the RBI manages it. The central bank is an active participant in the foreign-exchange market and intervenes to smooth sharp moves, so realised volatility stays compressed for long stretches and then jumps in bursts around policy or global shocks. The exchange-traded segment you see is a thin slice on top of a far larger over-the-counter (OTC) interbank and forward market, where banks and large corporates do most of the country's hedging. The exchange exists mainly to give smaller hedgers and traders a regulated, cleared venue with no counterparty risk.
Liquidity concentrates hard in the near-month USD-INR future and in at-the-money USD-INR options. The weekly contracts, the longer-dated months, and the non-dollar pairs are all much thinner, with wider spreads that punish anyone trading size. This is the same liquidity-concentration story you saw in equity F&O in Chapter 56, just with the depth even more lopsided toward a single contract.
The exchange-traded currency book is the visible tip of a much bigger OTC iceberg. Do not assume the screen depth in a weekly USD-INR contract or a EUR-INR future reflects real market liquidity - off the front month, spreads widen fast and a market order can move the price more than your edge.
Interest-rate futures and the shape of the curve
The second macro lever is the price of money. Start with the yield curve: plot the interest rate the market demands against the term you lend for - overnight, three months, one year, ten years - and you get a curve whose level and slope summarise the entire cost of capital in the economy. The short end is anchored by the RBI's repo rate, the policy rate at which banks borrow overnight against government bonds; the long end is set by the market's view of growth, inflation and the supply of paper.
Interest-rate futures (IRF) let you trade that curve on an exchange. The NSE lists futures on a notional 10-year Government of India bond and on the 91-day Treasury bill, settled against the underlying government securities. The number that matters for any rate instrument is DV01 (also written PV01): the rupee change in value for a one-basis-point move in yield, which is just price sensitivity times duration. A 10-year bond future carries a large DV01; a 91-day bill future a tiny one. Be honest about the venue, though - Indian IRF liquidity is episodic. It wakes up around RBI policy meetings and bond auctions and can be close to dead in between, so it works as a hedging instrument far better than as a day-trading playground.
DV01 and duration are to a bond what delta is to an option: the first-order sensitivity that tells you how much you make or lose per unit move in the underlying risk factor. Size a rate hedge by matching DV01, not by matching notional - a small position in a long-duration future can offset the rate risk of a much larger short-duration book.
Why a quant cares: the macro book
Here is the payoff. The rupee and the curve do not sit in a separate universe from equities - they constantly push and pull on each other. A weakening rupee raises the cost of imported energy and shrinks foreign-investor returns once they convert back into dollars; a sharp rate move reprices the discount factor sitting under every equity valuation. So a serious book carries macro hedges. An exporter, or a portfolio mirroring foreign-investor flows, is long dollars whether it likes it or not and can lay that risk off with USD-INR futures. A leveraged carry position is implicitly exposed to the rate curve and can hedge it with IRF.
Let's look at the cross-asset picture over the last year.
# USD-INR vs NIFTY over the last year, both rebased to 100 - the macro link.
import os
from pathlib import Path

import matplotlib

matplotlib.use("Agg")
import matplotlib.pyplot as plt
import numpy as np
import seaborn as sns
from openalgo import api

client = api(
    api_key=os.getenv("OPENALGO_API_KEY", "your_api_key_here"),
    host=os.getenv("OPENALGO_HOST", "http://127.0.0.1:5000"),
)

usd = client.history(symbol="USDINR29JUL26FUT", exchange="CDS", interval="D",
                     start_date="2025-06-28", end_date="2026-06-28")
nif = client.history(symbol="NIFTY", exchange="NSE_INDEX", interval="D",
                     start_date="2025-06-28", end_date="2026-06-28")

# Align on common trading days and rebase both series to 100 at the start.
common = usd.index.intersection(nif.index)
u, n = usd["close"].reindex(common), nif["close"].reindex(common)
u100, n100 = u / u.iloc[0] * 100, n / n.iloc[0] * 100
corr = np.log(u / u.shift(1)).corr(np.log(n / n.shift(1)))

sns.set_theme(style="whitegrid")
fig, ax = plt.subplots(figsize=(8, 4.4))
ax.plot(common, n100, color="#7c83ff", lw=1.6, label="NIFTY (equity index)")
ax.plot(common, u100, color="#dc2626", lw=1.6, label="USD-INR future (up = weaker rupee)")
ax.axhline(100, color="#888", lw=0.8, ls="--")
ax.set_title("USD-INR vs NIFTY over the last year (rebased to 100)")
ax.set_ylabel("Level (start = 100)")
ax.legend(loc="best", frameon=False)
out = Path(__file__).with_suffix(".png")
plt.savefig(out, dpi=110, bbox_inches="tight")

print(f"Window            : {common[0].date()} to {common[-1].date()} ({len(common)} days)")
print(f"USD-INR move      : {u.iloc[0]:.2f} -> {u.iloc[-1]:.2f}  ({(u.iloc[-1] / u.iloc[0] - 1) * 100:+.1f}%)")
print(f"NIFTY move        : {n.iloc[0]:.0f} -> {n.iloc[-1]:.0f}  ({(n.iloc[-1] / n.iloc[0] - 1) * 100:+.1f}%)")
print(f"Daily-return corr : {corr:+.2f}  (mildly inverse: a weaker rupee leans against equities)")
print(f"Saved chart : {out.name}")Window : 2025-07-29 to 2026-06-25 (219 days) USD-INR move : 88.77 -> 94.70 (+6.7%) NIFTY move : 24821 -> 24056 (-3.1%) Daily-return corr : -0.13 (mildly inverse: a weaker rupee leans against equities) Saved chart : 02_usdinr_vs_nifty.png
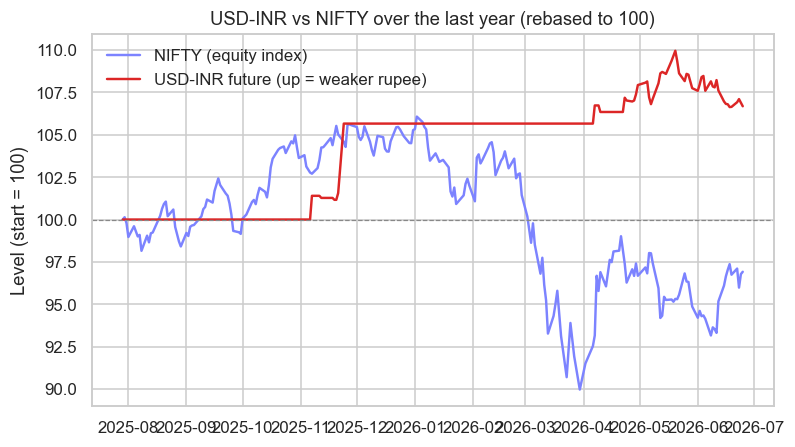
Over the window the USD-INR future climbed from 88.77 to 94.70 (+6.7%) as the rupee weakened, while NIFTY drifted from about 24,821 to 24,056 (-3.1%). The daily-return correlation came out at -0.13: mildly inverse. The dollar tends to firm when domestic equities wobble, because a risk-off mood drives foreign outflows that sell rupees. But notice how loose that number is. A correlation of -0.13 is barely a lean, not a law - in a calm year it is almost nothing, and in a genuine crisis it can tighten sharply. A quant treats this as a hedge ratio to estimate, rolling, regime by regime, never a constant to bank on.
Cross-asset correlations are regime-dependent. Estimate the USD-INR to NIFTY hedge ratio on a rolling window and expect it to change - sizing a currency hedge off a single full-sample number will leave you over-hedged in calm markets and under-hedged in exactly the crisis you were protecting against.
The options on USD-INR are priced the same way the rest of this module prices options: off the forward, with the Black-76 logic of Chapter 51, not off spot. The currency forward is pinned by covered interest parity - the rupee-dollar interest-rate differential is the cost of carry between the two currencies, which is the very same no-arbitrage carry idea from Chapter 49, now applied to two monies instead of an index and cash.
Currency and rate options obey the same forward-pricing law as equity options. The currency forward comes from covered interest parity (the rate differential is the carry); the option is priced off that forward with Black-76. One no-arbitrage principle runs through the entire derivatives module - only the underlying changes.
Liquidity, limits and the honest caveats
The currency and rate segments come with position limits that bite sooner than in equity F&O. Because these markets touch the external sector and monetary policy, SEBI and the RBI cap the gross open position any member or client may hold in currency derivatives. The precise caps - a percentage of total open interest or an absolute dollar figure, whichever is higher - are set by the exchange and the regulator and are revised from time to time, so read the current circular rather than trust a remembered number. Margins use the same SPAN-plus-exposure machinery you will meet in the next chapter, but applied to a small per-contract notional of 1000 dollars, which makes currency futures an unusually capital-light way to express or hedge a macro view.
The currency pit and the rate curve are where your equity book meets the macro economy. You now hold the whole derivatives toolkit - futures and carry, options and Greeks, the volatility surface, equity microstructure, and the currency-and-rates overlay on top. The next chapter closes the module by asking the question that decides whether any of it is actually tradeable: what does it cost to hold, in margin, collateral and position limits.