Order Flow & Participants
Informed vs uninformed flow, participant-wise open interest, and reading FII/DII activity.
- ·Informed vs uninformed flow
- ·Participant-wise OI
- ·FII/DII flow data
- ·Toxicity & adverse selection
- ·Retail's growing footprint
- ·Flow as a signal
A price is the fingerprint of a decision. Behind every tick is a real participant - a fund rebalancing, a hedger laying off risk, a retail trader chasing a tip, an algo arbitraging a gap - each with a different motive, size and level of information. The final skill of microstructure is learning to read that crowd: which orders carry information and which are just noise, and how to see the footprints institutions leave behind. This is order flow, and it's one of the few genuine edges left.
Informed versus uninformed flow
Not all orders are equal. Some carry information - a fund that has done deep research and is quietly accumulating. Others are uninformed - someone selling shares to pay a bill, an index fund mechanically rebalancing. They look identical in the book, but they mean opposite things.
This distinction is the whole game for a market maker. Quote both sides to earn the spread, and you're fine trading against uninformed flow - but every time you trade against someone who knows more than you, you lose. That's adverse selection (or "toxic" flow): the orders you most want to fill are exactly the ones that hurt. A huge amount of quant microstructure is really one question - how do I avoid being the uninformed side of the trade?
Open interest: the conviction meter
In F&O, you get a tool the cash market lacks: open interest (OI), the number of contracts currently live. Volume tells you how much traded; OI tells you how much stayed on. Read alongside price, it reveals whether a move has real money behind it or is just positions closing:
# Price tells you direction; open interest tells you conviction. Read them together.
import os
from datetime import datetime, timedelta

from openalgo import api

client = api(
    api_key=os.getenv("OPENALGO_API_KEY", "your_api_key_here"),
    host=os.getenv("OPENALGO_HOST", "http://127.0.0.1:5000"),
)

SYMBOL, EXCHANGE = "NIFTY30JUN26FUT", "NFO"
end = datetime.now().strftime("%Y-%m-%d")
start = (datetime.now() - timedelta(days=30)).strftime("%Y-%m-%d")
df = client.history(symbol=SYMBOL, exchange=EXCHANGE, interval="D", start_date=start, end_date=end)

df["dprice"] = df["close"].diff()
df["doi"] = df["oi"].diff()


def positioning(dp, doi):
    if dp > 0 and doi > 0:
        return "Long buildup (fresh bulls)"
    if dp < 0 and doi > 0:
        return "Short buildup (fresh bears)"
    if dp > 0 and doi < 0:
        return "Short covering (bears exit)"
    if dp < 0 and doi < 0:
        return "Long unwinding (bulls exit)"
    return "-"


print(f"{SYMBOL}\n{'DATE':12s}{'CLOSE':>10s}{'OI':>13s}   POSITIONING")
for ts, row in df.tail(8).iterrows():
    print(f"{str(ts.date()):12s}{row['close']:>10.1f}{int(row['oi']):>13d}   {positioning(row['dprice'], row['doi'])}")
print("\nRising price + rising OI = new money backing the move. Falling OI = positions closing.")NIFTY30JUN26FUT DATE CLOSE OI POSITIONING 2026-06-15 23916.6 17817930 Short covering (bears exit) 2026-06-16 24001.0 17180800 Short covering (bears exit) 2026-06-17 24094.0 16807115 Short covering (bears exit) 2026-06-18 24192.5 16511170 Short covering (bears exit) 2026-06-19 24056.9 16483480 Long unwinding (bulls exit) 2026-06-22 24123.8 16090685 Short covering (bears exit) 2026-06-23 23852.5 15876575 Long unwinding (bulls exit) 2026-06-24 24053.6 15404350 Short covering (bears exit) Rising price + rising OI = new money backing the move. Falling OI = positions closing.
Because we're close to expiry here, OI is falling across the board as traders roll over to the next month - so every move reads as positions closing (covering or unwinding) rather than fresh conviction. That itself is a lesson: near expiry, OI mechanics are dominated by rollover, not new bets. Earlier in a contract's life, you'd see the opposite - rising OI backing the trend.
The four regimes
Combine the direction of price with the direction of OI and you get four classic positioning regimes - the bedrock of how Indian F&O traders read the tape:
The two buildup quadrants (top) are the strong ones - new money is committing in the direction of the move, so the trend has conviction behind it. The two unwinding quadrants (bottom) are weaker - a rally on falling OI is just shorts buying back to exit, not fresh bulls, and it often fizzles. Same price move, completely different meaning, depending on what OI is doing underneath.
Watch it build and unwind
Plot a contract's price against its OI over its whole life and you can watch conviction arrive and leave:
# Watch price and open interest together - where conviction builds and where it leaves.
import os
from datetime import datetime, timedelta
from pathlib import Path

import matplotlib

matplotlib.use("Agg")
import matplotlib.pyplot as plt
import seaborn as sns
from openalgo import api

client = api(
    api_key=os.getenv("OPENALGO_API_KEY", "your_api_key_here"),
    host=os.getenv("OPENALGO_HOST", "http://127.0.0.1:5000"),
)

SYMBOL, EXCHANGE = "NIFTY30JUN26FUT", "NFO"
end = datetime.now().strftime("%Y-%m-%d")
start = (datetime.now() - timedelta(days=60)).strftime("%Y-%m-%d")
df = client.history(symbol=SYMBOL, exchange=EXCHANGE, interval="D", start_date=start, end_date=end)

sns.set_theme(style="whitegrid")
fig, ax1 = plt.subplots(figsize=(8, 4.5))
ax1.plot(df.index, df["close"], color="#7c83ff", lw=2, label="Price (close)")
ax1.set_ylabel("Price", color="#7c83ff")
ax1.tick_params(axis="y", labelcolor="#7c83ff")

ax2 = ax1.twinx()
ax2.fill_between(df.index, df["oi"] / 1e6, color="#16a34a", alpha=0.18)
ax2.plot(df.index, df["oi"] / 1e6, color="#16a34a", lw=1.5, label="Open interest (M)")
ax2.set_ylabel("Open interest (million)", color="#16a34a")
ax2.tick_params(axis="y", labelcolor="#16a34a")
ax2.grid(False)

ax1.set_title(f"{SYMBOL} - price vs open interest")
out = Path(__file__).with_suffix(".png")
plt.savefig(out, dpi=110, bbox_inches="tight")
print(f"OI moved {df['oi'].iloc[0] / 1e6:.1f}M -> {df['oi'].iloc[-1] / 1e6:.1f}M as expiry nears. Saved {out.name}")OI moved 8.3M -> 15.4M as expiry nears. Saved 02_oi_price_chart.png
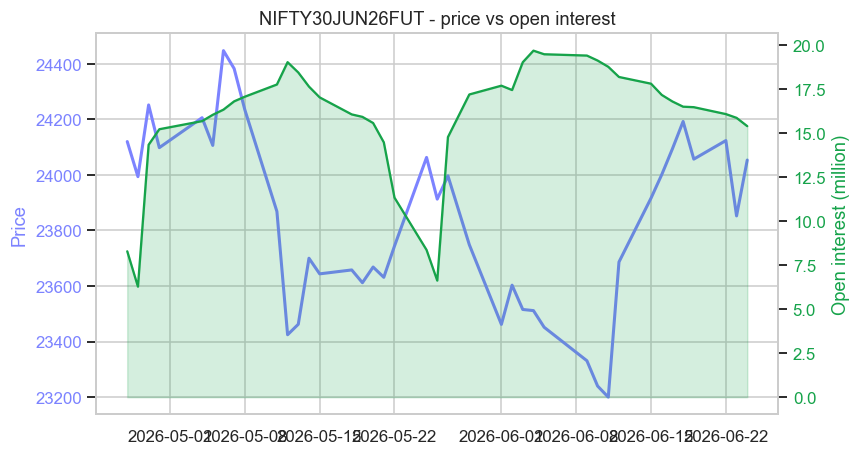
The OI swells as traders pile into the contract through the month, then deflates into expiry as everyone rolls to the next series. That arc - build, peak, unwind - repeats every single month, and quant strategies are built around its predictable rhythm (the expiry and rollover trades of Module G).
FII, DII and participant flow
India publishes something most markets don't: who traded. Every day you can see net FII/FPI (foreign) and DII (domestic institutional) cash flows, and participant-wise OI showing whether foreigners, domestic institutions, or proprietary desks are net long or short index futures. "FIIs sold ₹3,000 crore today" is genuinely market-moving information, because foreign flows drive large-caps, and DIIs are often the steady hand absorbing the other side. A quant treats these flows as a real, if noisy, sentiment signal.
The deepest microstructure edge isn't predicting price - it's reading who is on the other side. Informed flow, OI conviction, and FII/DII footprints are all attempts to answer one question: is the money behind this move smart or dumb? Trade with the smart, fade the dumb.
Flow as a signal - and its limits
A warning to balance the promise. Flow signals are noisy and easily misread: OI can rise for hedging, not speculation; FIIs sell for currency reasons unrelated to their view; a big print can be one leg of a spread. Order flow is a powerful supporting read, rarely a standalone trigger. Use it to understand the character of a move, not to blindly predict the next tick.
Try it yourself
- Run the positioning example on a stock future like
RELIANCE30JUN26FUT. Is the stock seeing fresh buildup or rollover unwinding right now? - Look up today's FII/DII cash figures on the NSE or any market site. Were foreigners and domestics on the same side, or opposite?
- Combine ideas: find a day with a strong price move and rising OI (real buildup). Did the move continue the next day more often than a move on falling OI?
Recap
- Every order is informed (carries a view) or uninformed (a liquidity need); the market maker's core risk is adverse selection - trading against the informed side.
- Open interest is the conviction meter: rising OI means fresh money committing, falling OI means positions closing.
- The four price-OI regimes - long buildup, short buildup, short covering, long unwinding - reveal whether a move has real backing or is just an exit.
- India uniquely publishes FII/DII flows and participant-wise OI - a genuine, if noisy, read on whether smart or dumb money is moving.
- Flow is a powerful read on a move's character, but it's noisy - a supporting signal, not a standalone trigger.
That completes our tour of market microstructure. We've gone from the order book to price formation, cost, the circuit-breakers that freeze it, and the flow that drives it. Now we change gears entirely: from how the market works to the mathematics that lets us model it - starting with returns and the strange, fat-tailed statistics of markets.