The Indian Trading Day Structure
From the pre-open to the post-close - every session of the NSE and BSE day, the timings and the special segments a quant must respect.
- ·Pre-open session
- ·Continuous trading
- ·Block and bulk windows
- ·Closing session and post-close
- ·Special pre-open for new listings
- ·Commodity and currency hours
A trading day looks, from the outside, like one continuous river of prices flowing from morning to afternoon. It isn't. The Indian market day is a sequence of distinct sessions, each with its own clock and its own matching rule, bolted together into something that only appears seamless. The single tick you see at 09:15 is not a normal trade at all - it is the cleared price of an auction that ran while the market looked shut. The last number of the day is usually not the last trade either. A quant who treats every timestamp as equivalent will misread liquidity, mis-time execution, and misunderstand the very first and last prices of the day. So let us take the day apart, session by session.
A day built from sessions
The cash equity day on the main Indian exchanges runs in four pieces. First a pre-open session from 09:00 to 09:15, a call auction that gathers orders and computes a single opening price. Then the long continuous session from 09:15 to 15:30, where orders match instantly on price-time priority (the engine from ch20). Then a short buffer while the closing price is computed, followed by a post-close session from 15:40 to 16:00 where you can trade at that fixed closing price. New listings get their own special opening. And the derivative cousins - commodities and currency - keep entirely different hours.
Pull one real day's minute bars and you can see the sessions in the data itself. The first bar's open is the auction print; the last bar's close sits just before the bell.
# Map a real trading day to its sessions: first and last prints of NIFTY 1m bars.
import os

import pandas as pd
from openalgo import api

client = api(
    api_key=os.getenv("OPENALGO_API_KEY", "your_api_key_here"),
    host=os.getenv("OPENALGO_HOST", "http://127.0.0.1:5000"),
)

# Pull a window of 1m bars and use the most recent trading day present.
df = client.history(symbol="NIFTY", exchange="NSE_INDEX", interval="1m",
                    start_date="2026-06-18", end_date="2026-06-28").sort_index()
last_day = df.index.normalize().max()
day = df[df.index.normalize() == last_day]

first, last = day.iloc[0], day.iloc[-1]
open_print, close_print = first["open"], last["close"]

print(f"NIFTY trading day {last_day.date()}   ({len(day)} one-minute bars)\n")
print(f"First bar  {first.name.time()}  -> continuous session opens; this opening print")
print(f"           comes out of the 09:00-09:15 pre-open call auction")
print(f"Opening print : {open_print:,.2f}")
print(f"Last bar   {last.name.time()}  -> last continuous minute before the 15:30 bell")
print(f"Closing print : {close_print:,.2f}")
print(f"\nDay open {first['open']:,.2f}  high {day['high'].max():,.2f}  "
      f"low {day['low'].min():,.2f}  close {close_print:,.2f}")

print("\nThe Indian equity day, mapped:")
for win, label in [("09:00-09:15", "pre-open call auction (order collection + price discovery)"),
                   ("09:15-15:30", "continuous trading (price-time matching)"),
                   ("15:30-15:40", "buffer before the closing session"),
                   ("15:40-16:00", "post-close / closing-price session")]:
print(f" {win} {label}")NIFTY trading day 2026-06-25 (375 one-minute bars)
First bar 09:15:00 -> continuous session opens; this opening print
comes out of the 09:00-09:15 pre-open call auction
Opening print : 24,125.85
Last bar 15:29:00 -> last continuous minute before the 15:30 bell
Closing print : 24,052.95
Day open 24,125.85 high 24,261.60 low 24,039.00 close 24,052.95
The Indian equity day, mapped:
09:00-09:15 pre-open call auction (order collection + price discovery)
09:15-15:30 continuous trading (price-time matching)
15:30-15:40 buffer before the closing session
15:40-16:00 post-close / closing-price sessionOn 25 June 2026, NIFTY produced 375 one-minute bars. The opening print was 24,125.85 - a single number born from the 09:00 to 09:15 call auction, not from a trade that happened at exactly 09:15:00. The day ranged between 24,039.00 and 24,261.60 and the final continuous minute closed at 24,052.95. Four hundred-odd numbers, but the first and last of them are special, and knowing why is the point of this chapter.
The trading day is not one continuous market. It is a chain of sessions - pre-open auction, continuous matching, closing computation, post-close - each governed by its own rule. The 09:15 opening print and the official close are auction-style prices, not ordinary trades.
Pre-open: where the opening print comes from
Indian equities open with a fifteen-minute call auction rather than a free-for-all. From 09:00 to roughly 09:08 the exchange simply collects orders - you may place, modify or cancel freely, but nothing trades. Over the next few minutes the system freezes new changes and computes the single price that maximises the quantity that can be matched - the equilibrium price. That price becomes the day's opening tick, and all crossable orders execute there at once. By 09:15 the book rolls into continuous trading carrying whatever did not match.
Why bother? Overnight, information piles up - global moves, results, policy. If thousands of orders hit a continuous book at once on the first millisecond, the open would be chaotic and easy to manipulate. Batching them into one auction produces a fairer, more robust opening price. The detailed mechanics of how that equilibrium price is found - the demand and supply curves, the tie-break rules - are the whole subject of the next chapter, so we will not duplicate them here.
The opening print can gap far from yesterday's close, and it is an auction-cleared price, not a tradeable quote you could have hit. Backtests that assume you "bought at the open" are assuming a fill at a price the auction set for everyone simultaneously. Model the open as an auction, not as a normal limit-order fill.
Continuous trading and the shape of the day
From 09:15 to 15:30 the market runs continuously: every incoming order matches immediately against the resting book by price-time priority, or joins the queue. This is the six-and-a-quarter-hour window where almost all of a quant's life happens. But it is far from uniform. Liquidity is heavily front- and back-loaded, and the cost of trading swings with it through the day.
The clearest way to see this is to average the traded volume at each minute-of-day across many sessions. The result is the famous intraday U-shape (some call it a smile): a violent burst at the open, a long sleepy trough through midday, and a swelling ramp into the close.
# The intraday volume U-shape: traded quantity by minute-of-day for a liquid stock.
import os
from pathlib import Path

import matplotlib

matplotlib.use("Agg")
import matplotlib.pyplot as plt
import pandas as pd
import seaborn as sns
from openalgo import api

client = api(
    api_key=os.getenv("OPENALGO_API_KEY", "your_api_key_here"),
    host=os.getenv("OPENALGO_HOST", "http://127.0.0.1:5000"),
)

SYMBOL = "RELIANCE"
df = client.history(symbol=SYMBOL, exchange="NSE", interval="1m",
                    start_date="2026-06-01", end_date="2026-06-28").sort_index()
ndays = df.index.normalize().nunique()

# Average traded volume at each minute-of-day across all sessions in the window.
df["mod"] = df.index.strftime("%H:%M")
prof = df.groupby("mod")["volume"].mean().reset_index()
prof["t"] = pd.to_datetime(prof["mod"], format="%H:%M")

sns.set_theme(style="whitegrid")
fig, ax = plt.subplots(figsize=(9, 4.5))
ax.fill_between(prof["t"], prof["volume"], color="#7c83ff", alpha=0.25)
ax.plot(prof["t"], prof["volume"], color="#7c83ff", linewidth=1.6)
ax.set_title(f"{SYMBOL} (NSE) - average traded volume by minute-of-day ({ndays} sessions)")
ax.set_xlabel("Time of day")
ax.set_ylabel("Avg shares traded per minute")
import matplotlib.dates as mdates
ax.xaxis.set_major_formatter(mdates.DateFormatter("%H:%M"))

out = Path(__file__).with_suffix(".png")
plt.savefig(out, dpi=110, bbox_inches="tight")

g = prof.set_index("mod")["volume"]
print(f"{SYMBOL}: open minute 09:15 avg {g['09:15']:,.0f} sh  vs  midday 12:00 avg "
f"{g['12:00']:,.0f} sh vs close 15:29 avg {g['15:29']:,.0f} sh. Saved {out.name}")RELIANCE: open minute 09:15 avg 330,941 sh vs midday 12:00 avg 25,844 sh vs close 15:29 avg 56,008 sh. Saved 02_volume_ushape.png
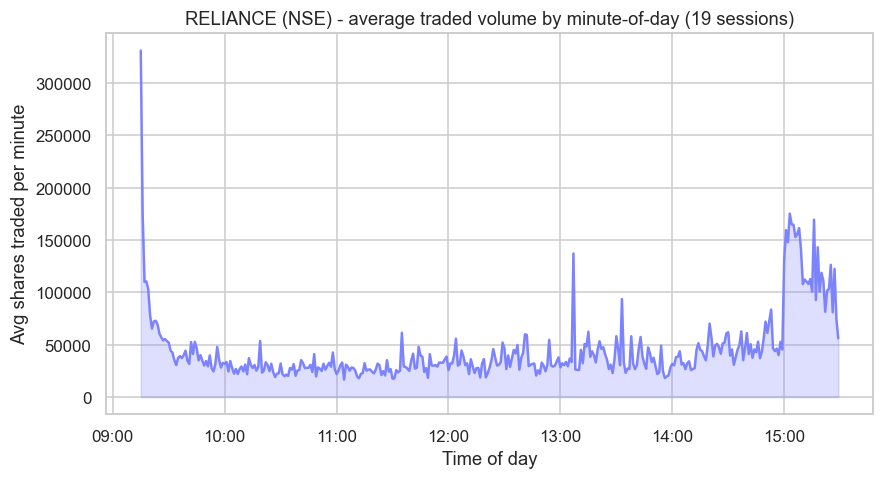
Across 19 recent sessions, the opening minute of RELIANCE carried about 330,941 shares on average. The noon minute carried just 25,844 - roughly one-thirteenth of the open. Then activity built back up, with the closing minute averaging 56,008 and the final half-hour swelling far beyond that as funds rushed to complete orders before the bell. This shape is universal across liquid Indian names, and it has hard consequences.
Trade where the liquidity is. Spreads are tightest and depth deepest near the open and the close; the midday lull is where a market order quietly pays the most slippage. If you must execute a large order at noon, slice it - the book is thin and your impact (ch26) is largest exactly when nobody else is around.
The close, the post-close, and special openings
The number most people call "the closing price" is not the last trade of the day. For index and equity securities it is the volume-weighted average price of the trades in the last thirty minutes of continuous trading, 15:00 to 15:30. Computing it from a robust window rather than a single final tick makes the close far harder to manipulate - and it matters enormously, because that closing price is the reference for mutual-fund NAVs, margin marks, settlement prices and index levels.
Between 15:30 and 15:40 the exchange computes that close. Then a post-close session runs from 15:40 to 16:00, in which you can place market orders that execute at the already-fixed closing price. It is a last chance to get in or out at the official close without taking intraday price risk. SEBI has also moved to formalise a dedicated closing auction session for the cash segment (circular dated 16 January 2026), tightening how the close is discovered - the auction machinery behind it is, again, the territory of the next chapter.
New listings get a different opening entirely. On the day a stock first lists - or when a long-suspended scrip resumes - normal continuous trading does not begin at 09:15. Instead a longer special pre-open session, a call auction of roughly 45 minutes, runs first so the market can discover a sensible price for an instrument with no recent history, after which continuous trading begins later that morning.
"Last price" and "closing price" are different objects. The last traded price is a single tick; the official close is a 30-minute volume-weighted average (15:00 to 15:30). When you build end-of-day series, decide deliberately which one you need - they can differ by several points on a choppy close.
Different markets, different clocks
The equity day ends at half past three, but the market does not go fully dark. Currency derivatives on the CDS segment trade from 09:00 to 17:00, with cross-currency pairs running even later, because they track a global, round-the-clock foreign-exchange market that does not care about Indian equity hours. Commodities on MCX run far longer still - from 09:00 into the night, to about 23:30 - so that domestic prices for crude, gold and metals stay tethered to international markets that are wide awake while NSE and BSE sleep. This is exactly why the live order-book example back in ch18 used an MCX contract: it was the only book still trading after the equity close.
For a quant, these overlapping clocks are an opportunity and a hazard. A position in a stock future is frozen overnight, but the macro forces that will gap it open are being priced right now in currency and commodity books that are still live. The day's structure, in other words, does not end at the equity bell - it just moves to a different venue.
We have walked the day from the opening auction to the night session. The recurring theme is that the first price and the last price are constructed, not merely traded, and that liquidity has a strong intraday shape every execution algorithm must respect. Next we open up the call auction itself - the precise mechanism that turns a pile of pre-open orders into that single opening, and now closing, print.