Circuit Breakers, Bands & Surveillance
Index halts, scrip price bands, ASM/GSM and the F&O ban - and how they distort the signals you compute.
- ·Index circuit breakers
- ·Scrip price bands
- ·ASM & GSM lists
- ·The F&O ban period
- ·Upper/lower circuits
- ·Surveillance and your signals
Most days, the market is a calm, orderly auction. But every so often - a pandemic, a shock result, a flash crash abroad - it isn't, and the machinery we've studied could spiral into panic. So the exchanges built circuit breakers: hard limits that halt trading when prices move too far, too fast. For a quant these aren't trivia - they create days where your data goes strange, your indicators break, and your exit simply isn't there. Knowing exactly when and how the market freezes is part of knowing the market at all.
Index circuit breakers
When a benchmark index moves violently, the whole market stops. India's index circuit breakers trip at 10%, 15% and 20% moves, each triggering a trading halt of increasing length. How often does that actually happen? Let's look at seven years of Nifty:
# Circuit breakers exist for the market's worst days. How often is one actually tripped?
import os
from datetime import datetime

from openalgo import api

client = api(
    api_key=os.getenv("OPENALGO_API_KEY", "your_api_key_here"),
    host=os.getenv("OPENALGO_HOST", "http://127.0.0.1:5000"),
)

end = datetime.now().strftime("%Y-%m-%d")
df = client.history(symbol="NIFTY", exchange="NSE_INDEX", interval="D",
                    start_date="2019-01-01", end_date=end)
r = df["close"].pct_change().dropna() * 100      # daily % moves


def circuit(move):
    m = abs(move)
    if m >= 20:
        return "20% - halt for the day"
    if m >= 15:
        return "15% - long halt"
    if m >= 10:
        return "10% - 45-min halt"
    return "-"


print(f"{len(df)} NIFTY sessions since 2019\n")
print("Biggest DOWN days:")
for ts, move in r.nsmallest(4).items():
    print(f"  {ts.date()}  {move:7.2f}%   circuit: {circuit(move)}")
print("\nBiggest UP days:")
for ts, move in r.nlargest(4).items():
    print(f"  {ts.date()}  {move:7.2f}%   circuit: {circuit(move)}")
print(f"\nSessions that tripped an index circuit (>=10%): {(r.abs() >= 10).sum()} of {len(r)}")1854 NIFTY sessions since 2019 Biggest DOWN days: 2020-03-23 -12.98% circuit: 10% - 45-min halt 2020-03-12 -8.30% circuit: - 2020-03-16 -7.61% circuit: - 2024-06-04 -5.93% circuit: - Biggest UP days: 2020-04-07 8.76% circuit: - 2020-03-25 6.62% circuit: - 2020-03-20 5.83% circuit: - 2019-09-20 5.32% circuit: - Sessions that tripped an index circuit (>=10%): 1 of 1853
There it is, in real data. In 1,853 sessions, the index circuit was tripped exactly once - 23 March 2020, the COVID crash, when Nifty fell nearly 13% and the market was halted for 45 minutes. Every other terrifying day - the 8% drops, the election-result swing - stayed under the 10% line. Circuit breakers are the market's emergency brake: almost never needed, but the one time it is, it stops a panic from feeding on itself.
How rare is "rare"?
Plot all seven years and the circuit lines sit far out in the tail, where almost nothing lives:
# How far in the tail does a 10% circuit sit? Plot 7 years of Nifty daily moves.
import os
from datetime import datetime
from pathlib import Path

import matplotlib

matplotlib.use("Agg")
import matplotlib.pyplot as plt
import seaborn as sns
from openalgo import api

client = api(
    api_key=os.getenv("OPENALGO_API_KEY", "your_api_key_here"),
    host=os.getenv("OPENALGO_HOST", "http://127.0.0.1:5000"),
)

end = datetime.now().strftime("%Y-%m-%d")
df = client.history(symbol="NIFTY", exchange="NSE_INDEX", interval="D",
                    start_date="2019-01-01", end_date=end)
r = df["close"].pct_change().dropna() * 100

sns.set_theme(style="whitegrid")
fig, ax = plt.subplots(figsize=(8, 4.5))
sns.histplot(r, bins=80, color="#7c83ff", edgecolor="none", ax=ax)
ax.axvline(-10, color="#dc2626", ls="--", lw=1.5, label="10% circuit")
ax.axvline(10, color="#dc2626", ls="--", lw=1.5)
worst = r.min()
ax.annotate(f"COVID, 23-Mar-2020\n{worst:.1f}%", xy=(worst, 2), xytext=(worst + 1.5, 60),
            color="#dc2626", fontsize=9, arrowprops=dict(arrowstyle="->", color="#dc2626"))
ax.set_title("NIFTY daily moves since 2019 - and the 10% circuit lines")
ax.set_xlabel("Daily move (%)")
ax.set_ylabel("Number of sessions")
ax.legend()

out = Path(__file__).with_suffix(".png")
plt.savefig(out, dpi=110, bbox_inches="tight")
print(f"Worst day {worst:.2f}%. Days beyond +/-10%: {(r.abs() >= 10).sum()}. Saved {out.name}")Worst day -12.98%. Days beyond +/-10%: 1. Saved 02_circuit_distribution.png
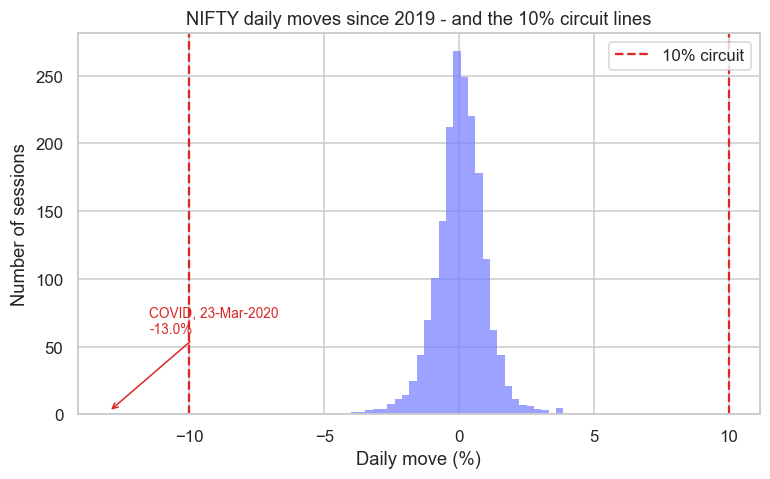
That lonely bar near -13%, way past the dashed line, is the only time the index brake engaged. The picture makes the design philosophy obvious: set the limit so far out that normal volatility never touches it, and it only fires in a genuine emergency.
Scrip price bands
Individual stocks have their own limits - daily price bands (commonly 2%, 5%, 10% or 20%, depending on the stock) beyond which they simply can't trade that day. Hit the top of the band and the stock is locked at upper circuit; hit the bottom and it's locked at lower circuit:
The cruelty of a lock is in the direction. When a stock is locked at the lower circuit, there are only sellers and no buyers - the one moment you desperately want out, there's no one to sell to, and you're trapped until the next session (often to a worse open). A locked book isn't thin liquidity; it's zero liquidity. Any quant trading small-caps must price this trapdoor risk in.
ASM, GSM and the F&O ban
Beyond circuits, SEBI runs surveillance that quietly changes the rules on specific names:
- ASM (Additional Surveillance Measure) and GSM (Graded Surveillance Measure) lists flag stocks with unusual price or volume behaviour, slapping on higher margins, tighter bands, or even forcing trade-for-trade (no intraday) settlement.
- The F&O ban kicks in when a stock's open interest crosses 95% of the market-wide limit: no new F&O positions allowed, only squaring off. A name in ban behaves very differently - and a strategy that ignores the ban list will try to place orders that simply get rejected.
Surveillance lists are a silent strategy killer. A backtest happily "trades" a stock that, in reality, was in GSM (no intraday allowed) or F&O ban (no new positions). If your data and your rules don't know about these states, your backtest is trading a market that didn't exist.
Why a quant cares
Circuits and bands distort the very data quants feed their models:
- A locked day has no real trading range - high, low and close collapse to one number, and any indicator built on range (ATR, Bollinger, candles) silently breaks.
- Gaps explode around circuit days as pent-up orders release at the next open, wrecking strategies that assume continuous prices.
- Liquidity vanishes exactly when you need it - the lower-circuit trapdoor means your stop-loss can't fill.
- Survivorship and eligibility - stocks drift in and out of ASM/GSM/ban, so a clean universe must track these states through time.
Market structure isn't just how things work on a normal day - it's also how they break on an abnormal one. A robust quant strategy is designed knowing that circuits, bands and bans exist, and that the worst day is the one your model has seen least.
Try it yourself
- Run the first example on
BANKNIFTY. Did the banking index ever trip its own circuit in this window? Banks are more volatile than the broad index. - Pick a small-cap and scan its history for days where
high == low- a likely circuit lock. How many can you find, and what happens to its range-based indicators on those days? - Look up today's F&O ban list and ASM/GSM lists on the NSE site. How many names are restricted right now - and would your strategy have known?
Recap
- Index circuit breakers (10/15/20%) halt the entire market; in 1,853 Nifty sessions, only the COVID crash of March 2020 tripped one.
- The limits sit far out in the tail by design - they fire only in genuine emergencies, never in normal volatility.
- Individual stocks have daily price bands; hitting them locks the stock at upper (no sellers) or lower (no buyers) circuit - and a lower lock is a liquidity trapdoor.
- ASM, GSM and the F&O ban quietly restrict specific names; ignoring them lets a backtest trade a market that didn't exist.
- Circuits and bands distort the data quants rely on - locked days kill range indicators, gaps break continuity, and liquidity vanishes when you most need it.
We've now seen how the market is built, how it prices, what it costs, and how it freezes. The last piece of microstructure is the most human: who is trading and why - reading order flow, informed money, and the FII/DII footprints.