Regimes & Structural Breaks
Markets switch between calm bulls, grinding bears and violent shocks - detecting the regime you're in.
- ·Bull / bear / sideways regimes
- ·Volatility regimes
- ·Markov switching (intuition)
- ·Change-point detection
- ·Structural breaks
- ·Why a strategy stops working
A strategy can print money for two years and then, with nothing changed in its code, simply stop working. Newcomers assume they broke something. Usually they didn't - the market changed. Markets have moods, called regimes: long stretches of calm bull markets, grinding bears, violent crashes, sleepy ranges. Each has its own statistics, and a strategy tuned to one can quietly bleed to death in another. Recognising the regime you're in - and knowing it will eventually flip - is what keeps a quant alive across the years. This closes our mathematics module.
The market has moods
Let's make regimes concrete. We'll split Nifty two ways at once - trend (above or below its 200-day average) and volatility (calm or turbulent) - giving four regimes, and measure the average daily return in each:
# Markets switch between regimes. Classify them and watch returns change completely.
import os
from datetime import datetime

import numpy as np
from openalgo import api

client = api(
    api_key=os.getenv("OPENALGO_API_KEY", "your_api_key_here"),
    host=os.getenv("OPENALGO_HOST", "http://127.0.0.1:5000"),
)

end = datetime.now().strftime("%Y-%m-%d")
df = client.history(symbol="NIFTY", exchange="NSE_INDEX", interval="D",
                    start_date="2019-01-01", end_date=end)
df["ret"] = df["close"].pct_change()
df["sma200"] = df["close"].rolling(200).mean()
df["vol20"] = df["ret"].rolling(20).std() * (252 ** 0.5) * 100      # annualised %
df = df.dropna()

df["trend"] = np.where(df["close"] > df["sma200"], "Bull", "Bear")
df["vol"] = np.where(df["vol20"] > df["vol20"].median(), "Turbulent", "Calm")

print(f"{'REGIME':20s}{'DAYS':>7s}{'AVG DAILY RETURN':>18s}")
for (t, v), g in df.groupby(["trend", "vol"]):
    print(f"{t + ' / ' + v:20s}{len(g):>7d}{g['ret'].mean() * 100:>17.3f}%")

print(f"\nToday's regime: {df['trend'].iloc[-1]} / {df['vol'].iloc[-1]}")
print("Same market, four personalities - a strategy tuned for one can bleed in another.")REGIME DAYS AVG DAILY RETURN Bear / Calm 66 0.002% Bear / Turbulent 299 -0.089% Bull / Calm 762 0.059% Bull / Turbulent 528 0.123% Today's regime: Bear / Turbulent Same market, four personalities - a strategy tuned for one can bleed in another.
The four personalities are unmistakable. A bull-and-turbulent regime (the post-COVID rocket) delivered the fattest daily returns; a bear-and-turbulent regime (crashes) was the worst, bleeding daily. The same index behaves like four different assets depending on its mood - and notice today's regime sits right there in the output. A trend-following strategy thrives in the bull rows and dies in the choppy ones; a mean-reverter does the opposite. There is no single "the market" to optimise for.
See the regimes
Shade the turbulent stretches under Nifty's trend line and the moods leap off the chart:
# See the regimes: Nifty's trend line, with turbulent (high-vol) stretches shaded.
import os
from datetime import datetime
from pathlib import Path

import matplotlib

matplotlib.use("Agg")
import matplotlib.pyplot as plt
import seaborn as sns
from openalgo import api

client = api(
    api_key=os.getenv("OPENALGO_API_KEY", "your_api_key_here"),
    host=os.getenv("OPENALGO_HOST", "http://127.0.0.1:5000"),
)

end = datetime.now().strftime("%Y-%m-%d")
df = client.history(symbol="NIFTY", exchange="NSE_INDEX", interval="D",
                    start_date="2019-01-01", end_date=end)
df["sma200"] = df["close"].rolling(200).mean()
df["vol20"] = df["close"].pct_change().rolling(20).std() * (252 ** 0.5) * 100
df = df.dropna()
turbulent = df["vol20"] > df["vol20"].median()

sns.set_theme(style="whitegrid")
fig, ax = plt.subplots(figsize=(8, 4.5))
ax.plot(df.index, df["close"], color="#7c83ff", lw=1.2, label="NIFTY")
ax.plot(df.index, df["sma200"], color="#888", lw=1.3, ls="--", label="200-day trend")
ax.fill_between(df.index, df["close"].min(), df["close"].max(),
                where=turbulent, color="#dc2626", alpha=0.12, label="turbulent (high vol)")
ax.set_title("NIFTY regimes - trend (line) and turbulence (shaded)")
ax.set_ylabel("Price")
ax.legend(loc="upper left")

out = Path(__file__).with_suffix(".png")
plt.savefig(out, dpi=110, bbox_inches="tight")
print(f"{int(turbulent.sum())} of {len(df)} days were turbulent. Today {'turbulent' if turbulent.iloc[-1] else 'calm'}. Saved {out.name}")827 of 1655 days were turbulent. Today turbulent. Saved 02_regime_chart.png
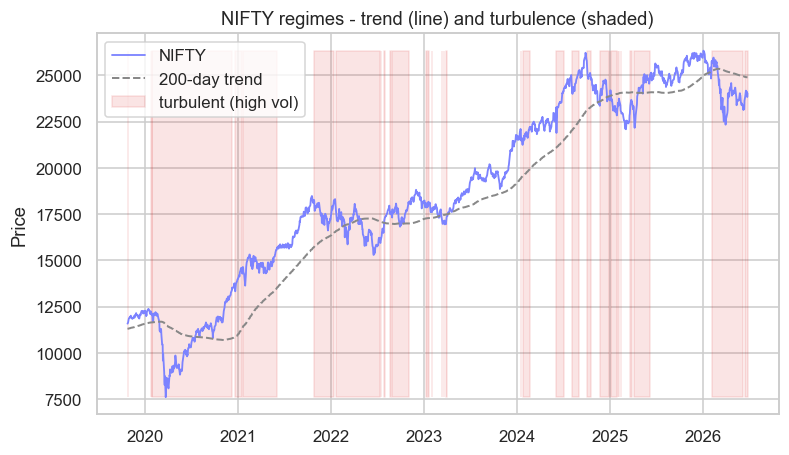
The red bands - high-volatility regimes - cluster around the crashes and the frantic recoveries, while the calm stretches ride the trend smoothly. You can see the market switching between characters, sometimes for months at a time. That persistence is the key feature, and it's exactly what a regime model tries to capture.
Regimes persist, then flip
Regimes don't change every day - they stick. A calm market tends to stay calm; a turbulent one tends to stay turbulent; and then, occasionally, it flips abruptly. That "mostly stays, rarely switches" behaviour is captured by a Markov-switching model, which treats the regime as a hidden state with sticky transition probabilities:
The fat self-loops are the point: most days, tomorrow's regime equals today's. That stickiness is why regimes are worth detecting at all - if they flipped randomly each day, knowing today's mood would be useless. Because they persist, knowing you're in a turbulent regime tells you tomorrow will probably be turbulent too.
Structural breaks
A regime flip is temporary - it reverts. A structural break is permanent: the underlying rules change and never change back. A new tax regime, a major regulatory shift, a company that transforms through a merger, a market that adds derivatives - after these, the old statistics simply don't apply. Change-point detection is the family of techniques for spotting the moment the data-generating process itself changed, as opposed to a mood that will pass. Telling the two apart - a regime that will revert versus a break that won't - is one of the hardest and most valuable judgements in the craft.
Why strategies stop working
This is the real reason behind most "my backtest worked but live failed" stories. The strategy was, without anyone realising, fitted to a regime. A momentum system that shone through a smooth bull market gets shredded the moment the market turns choppy and mean-reverting. A volatility-selling strategy that printed steady income for years is wiped out in a single regime shift to turbulence. The edge was never universal; it was regime-specific, and the regime changed.
Always ask of any edge: in which regime does this work, and what happens when the regime flips? A strategy without an answer is a time bomb. The mark of a professional isn't a strategy that works everywhere - that rarely exists - but one whose failure conditions are known and managed.
Defending against regime change
You can't stop regimes from changing, but you can stop them from ruining you:
- Regime-aware sizing. Cut size - or switch off entirely - in regimes hostile to your strategy, using the volatility forecasts of Chapter 16 as your early-warning system.
- Diversify across strategy types. Pair a trend-follower with a mean-reverter; when one suffers in its bad regime, the other often thrives, smoothing the whole book.
- Monitor for breaks. Periodically re-test the assumptions an edge depends on (a cointegration, a correlation, an expectancy). When they quietly drift, act before the strategy does the telling for you.
Try it yourself
- Compute a trend-following signal's returns separately in the calm and turbulent regimes. Does it really only work in one of them?
- Add a third volatility bucket (terciles instead of a median split) so you have low/medium/high. Does the return pattern sharpen?
- Find the single day your regime label last flipped from calm to turbulent. What was happening in the market that week?
Recap
- Markets move through regimes - bull/bear crossed with calm/turbulent - and the same index behaves like four different assets across them.
- Returns differ sharply by regime: bull-turbulent was the strongest, bear-turbulent the weakest - so a strategy tuned to one can bleed in another.
- Regimes are sticky - a Markov-switching view captures how they usually persist and only rarely flip.
- A structural break is permanent (the rules changed for good), unlike a regime flip that reverts - and change-point detection tries to tell them apart.
- Most "it stopped working" failures are regime-specific edges meeting a new regime - defend with regime-aware sizing, diversification across strategy types, and monitoring for breaks.
That completes Module D - the models for everything in markets that genuinely has memory: volatility, relationships, and regimes. Now we turn to the richest, most mathematical corner of all: derivatives. Options don't just track the market, they price uncertainty itself - and in India, they're priced with a model built for futures: Black-76.