Price Formation & Auctions
The matching engine, the tick-size regime, and the pre-open and closing call auctions that bookend the day.
- ·How a trade matches
- ·Tick size & its effects
- ·The pre-open call auction
- ·The closing auction
- ·Equilibrium price discovery
- ·Auction vs continuous trading
In the last chapter we read the order book - a frozen snapshot of resting orders. But a market is a movie, not a photo. Thousands of orders arrive every second, each at its own price, and somehow a single agreed price emerges and keeps updating. How? Understanding price formation - the engine and the auctions behind it - is what separates someone who reads charts from someone who understands markets. Let's watch the price being born.
The matching engine
At the centre of every exchange sits a piece of software called the matching engine. Its job is mechanical and relentless: take every incoming order and match it against the resting book using the price-time priority rule from Chapter 5. When a buy and a sell agree on a price, a trade prints, the last price updates, and the book shifts. Repeat, millions of times a day.
This is a continuous double auction - "double" because both buyers and sellers post prices, "continuous" because matching happens non-stop through the session. No human sets the price; it emerges from the constant collision of orders. That emergence is the deepest idea in markets: price is not a fact handed down, it's the running outcome of a negotiation between everyone present.
The tick: the price grid
Orders can't be placed at just any price - they must land on a grid. The spacing of that grid is the tick size, the smallest legal price step. Let's look a few up:
# Every instrument moves in fixed steps - the tick size. Let's look a few up.
import os

from openalgo import api

client = api(
    api_key=os.getenv("OPENALGO_API_KEY", "your_api_key_here"),
    host=os.getenv("OPENALGO_HOST", "http://127.0.0.1:5000"),
)

instruments = [
    ("RELIANCE", "NSE"),
    ("MRF", "NSE"),                    # India's priciest share - same tick as a cheap one
    ("NIFTY", "NSE_INDEX"),
    ("CRUDEOIL20JUL26FUT", "MCX"),
]

print(f"{'INSTRUMENT':24s}{'TICK':>8s}{'LOT':>8s}  TYPE")
for sym, exch in instruments:
    d = client.symbol(symbol=sym, exchange=exch)["data"]
    print(f"{sym:24s}{d['tick_size']:>8}{d['lotsize']:>8}  {d['instrumenttype']}")

print("\nThe tick is the smallest legal price step - the grid every quote must land on.")INSTRUMENT TICK LOT TYPE RELIANCE 0.1 1 EQ MRF 5.0 1 EQ NIFTY 0.0005 1 INDEX CRUDEOIL20JUL26FUT 1.0 1 FUT The tick is the smallest legal price step - the grid every quote must land on.
Notice the spread of values. Most shares step in small ticks, but MRF - India's priciest stock at over a lakh per share - has a far larger tick, because a tiny step on a huge price would be pointless. An index value carries a tiny tick; a commodity future its own. The tick matters more than it looks:
- Too small and the book fragments into noise, quotes flicker meaninglessly, and matching slows.
- Too large and it forces a wide spread - buyers and sellers can't meet in between - making the instrument expensive to trade.
The tick size sets the minimum possible spread, and therefore a floor on trading cost. A quant studying a thinly traded contract always checks the tick first - it quietly caps how cheap that market can ever be.
Demand, supply, and the gap
Here's price formation made visible. Stack up the order book into two curves - cumulative demand (how much buyers want at each price or better) and cumulative supply (how much sellers offer) - and look at where they sit:
# Price discovery: stack up demand and supply and see where they would meet.
import os
from pathlib import Path

import matplotlib

matplotlib.use("Agg")
import matplotlib.pyplot as plt
import pandas as pd
import seaborn as sns
from openalgo import api

client = api(
    api_key=os.getenv("OPENALGO_API_KEY", "your_api_key_here"),
    host=os.getenv("OPENALGO_HOST", "http://127.0.0.1:5000"),
)

SYMBOL, EXCHANGE = "CRUDEOIL20JUL26FUT", "MCX"
d = client.depth(symbol=SYMBOL, exchange=EXCHANGE)["data"]

bids = pd.DataFrame(d["bids"]).sort_values("price", ascending=False)
asks = pd.DataFrame(d["asks"]).sort_values("price", ascending=True)
bids["cum"] = bids["quantity"].cumsum()    # buyers willing to pay this price or more
asks["cum"] = asks["quantity"].cumsum()    # sellers willing to sell this price or less

sns.set_theme(style="whitegrid")
fig, ax = plt.subplots(figsize=(8, 4.5))
ax.step(bids["price"], bids["cum"], where="post", color="#16a34a", lw=2, label="Demand (cumulative buyers)")
ax.step(asks["price"], asks["cum"], where="post", color="#dc2626", lw=2, label="Supply (cumulative sellers)")
best_bid, best_ask = bids["price"].iloc[0], asks["price"].iloc[0]
ax.axvspan(best_bid, best_ask, color="#9ca3af", alpha=0.18, label=f"the spread ({best_ask - best_bid:.0f})")
ax.set_title(f"{SYMBOL} - demand, supply and the gap between them")
ax.set_xlabel("Price")
ax.set_ylabel("Cumulative quantity")
ax.legend()

out = Path(__file__).with_suffix(".png")
plt.savefig(out, dpi=110, bbox_inches="tight")
print(f"Demand sits at <= {best_bid:.0f}, supply at >= {best_ask:.0f} - the gap is the spread. Saved {out.name}")Demand sits at <= 6787, supply at >= 6789 - the gap is the spread. Saved 02_price_discovery.png
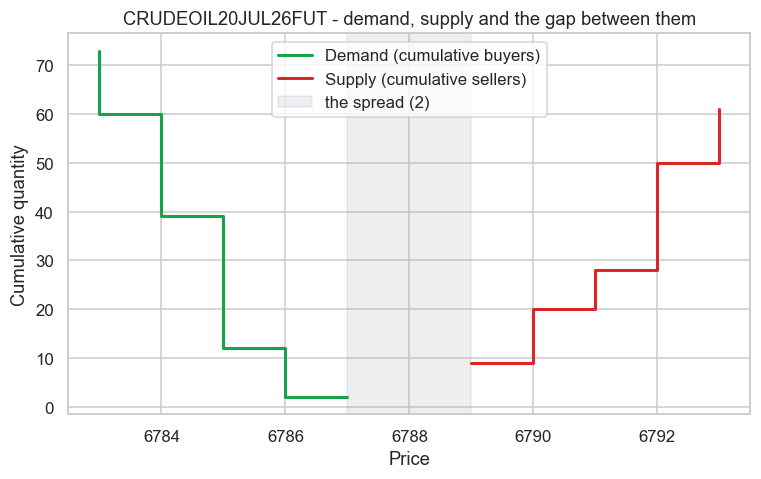
In continuous trading the two curves don't touch - there's a gap between the highest bid and the lowest ask. That gap is exactly the spread, and it exists because the buyers and sellers who would cross it have already traded and left. Only the non-overlapping orders remain, resting on either side. The last price lives somewhere in that gap, nudged tick by tick as new orders arrive.
The call auction: one price for everyone
But twice a day, India does something different. At the pre-open (and again at the close), the exchange stops continuous matching and runs a call auction: it collects orders for a few minutes without matching them, then finds the single price that trades the maximum quantity - the price where demand and supply finally cross.
This is why the market doesn't open in chaos. Overnight, news piles up and orders scatter across many prices; the pre-open auction gathers them all and discovers one fair opening price where the most trades can happen, instead of a violent first-second scramble. Everyone who participates gets that same price - a small marvel of coordination.
The closing auction
The session ends the same way. In the final minutes a closing auction sets the official closing price - and that number is far more important than it looks. It's the price that index values are struck at, that mutual funds use to value your holdings, and that benchmark-tracking funds must trade at. Because so much money needs the closing price, the close is one of the most liquid, most strategically important moments of the day - a fact event-driven quants (Module G) build entire strategies around.
Try it yourself
- Look up the tick size of a penny stock and a ₹5,000 share. How does the tick as a percentage of price compare - and which is cheaper to trade because of it?
- In the demand/supply example, switch to
GOLDM03JUL26FUT. Is gold's gap (spread) wider or narrower than crude's, relative to price? - During the 9:00-9:15 pre-open window, watch a liquid stock. Can you see the indicative opening price update as orders arrive?
Recap
- Price is set by a matching engine running a continuous double auction - it emerges from colliding orders, no one decrees it.
- The tick size is the price grid's smallest step; it sets the minimum possible spread and a floor on trading cost, and it varies widely (MRF's tick dwarfs a normal stock's).
- In continuous trading, cumulative demand and supply don't overlap - the gap between them is the spread.
- Twice a day a call auction (pre-open and close) collects orders and finds the single price that maximises matched quantity, so the market opens and closes in order, not chaos.
- The closing auction sets the official close that indices and funds depend on - making the close a high-stakes, high-liquidity moment.
We can now read the book and watch price form. Next we put a number on the thing every execution desk obsesses over: liquidity - the spread, the depth, and how much your own order pushes the price against you.